Woddonee might appreciate this chart. Old Sabretoothed put this up a few years ago. I grabbed a copy and have trotted it out onto HC a few times myself over the years. I really don't know how much attention to pay to it as every year is different but I do take notice of that big surge from a yearly low in late august to a high early october.....this chart would agree with woddonee's mate Jim Puplava as we are coming to the seasonally lowest point of the year for gold.
I used to be a gold bug and I can show the burnt stumps that were once fingers from the days when I was a gold stock "investor". Largely I avoid gold stocks now but have made a habit of "having a dash" in September. Last year at that time I made some good coin on BCN and would have absolutely cleaned up had I not got caught holding massive amounts of stock when they announced a huge cap raising....thems the breaks better luck this year.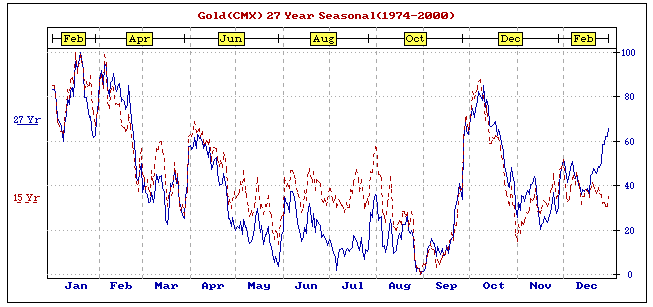
thursday, page-44


Add XJO (ASX) to my watchlist
 (20min delay) (20min delay)
|
|||||
|
Last
8,150.0 |
Change
-55.200(0.67%) |
Mkt cap ! n/a | |||
| Open | High | Low |
| 8,205.2 | 8,205.2 | 8,107.6 |
| XJO (ASX) Chart |