I have read a few commentators thoughts lately suggesting a bottom level similar to what flanagan suggests. I am sure when it is all said and done we will look back and see a very good fib/chart reason for the bottom. So I have been trying to preempt that by calculating a whole range of fib type levels and seeing which ones have decent long term chart support. I have looked at 38.2%, 50%, 61.8% and 66% falls in the DOW as well as 100%, 138.2%, 161.8% and 166% retraces of the entire 2002 -2007 bull.
A 50% fall has traditionally been it for these types of bears and there is good chart support for that case....the 2002 low for starters.......
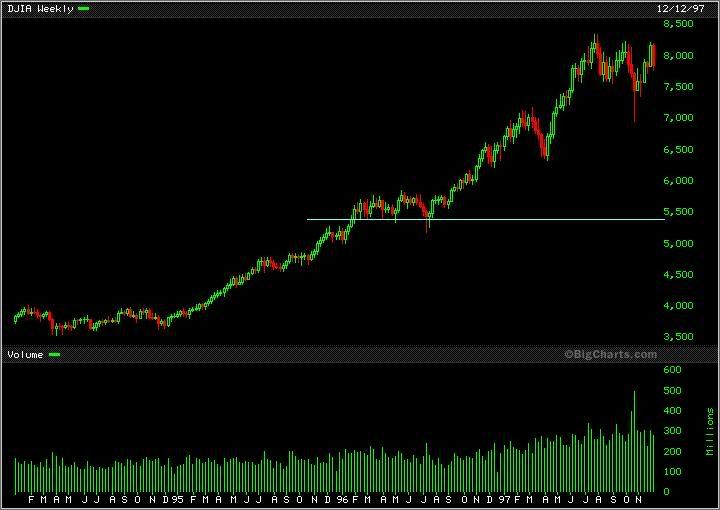
but should things be a little worse this time then the 2 best levels I see are a 61.8% retrace of the DOW back to 5455. See the chart below. In 2 years from start or 1995 to start 1997 the DOW doubled from roughly 3.5k to 7k....the only pause/support was for the first 6 months of 1996 which is approximately around the level of which I speak......The only other fib level I can come up with that has decent long term support is the 87 high (161.8% retrace of 2002-2007 bull) which was support/resistance for several years into the early 1990s....I put that chart up the other day but here it is again as well. The scarey part is that if the 2002 support fails then the 87 high is the next level of comparable chart support.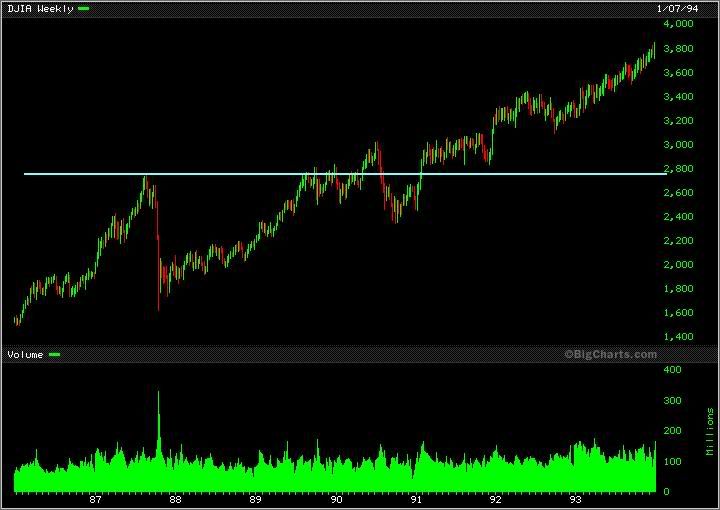
thursday's trading, page-55


Add XJO (ASX) to my watchlist
 (20min delay) (20min delay)
|
|||||
|
Last
7,959.3 |
Change
69.700(0.88%) |
Mkt cap ! n/a | |||
| Open | High | Low |
| 7,889.6 | 7,969.1 | 7,889.0 |
| XJO (ASX) Chart |