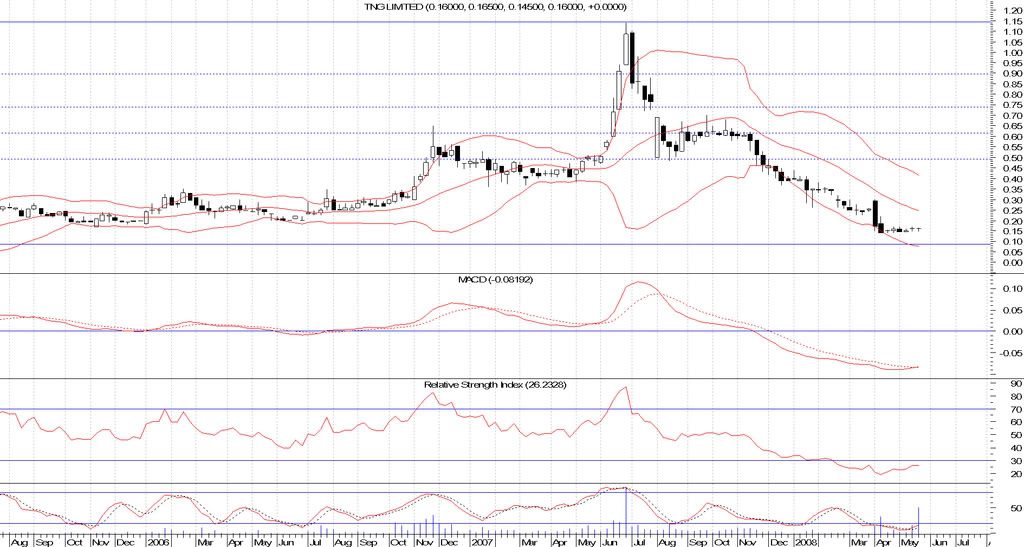
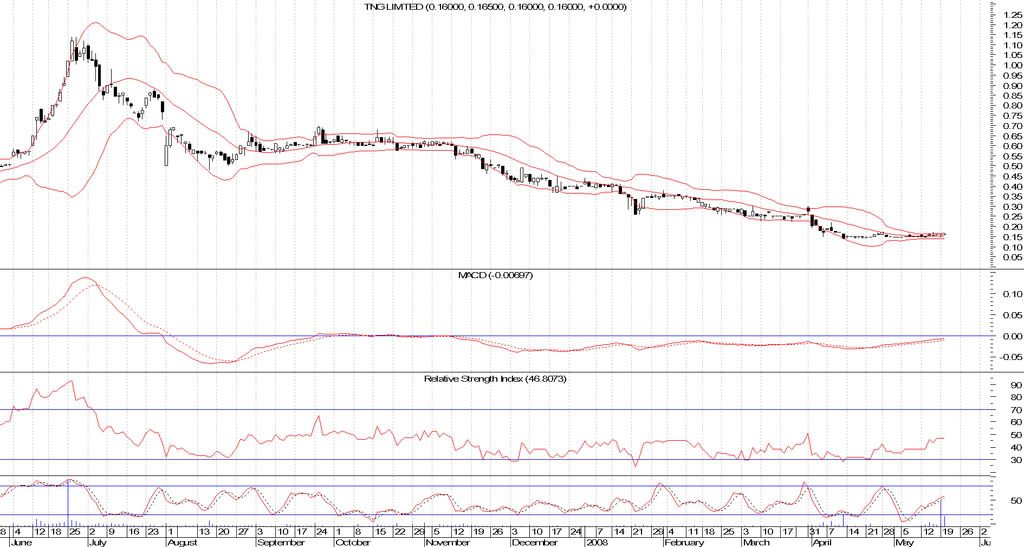
Howdy trendfriend, Yep I concur that it has likely found a base. The daily chart shows very tight bollinger bands, which indicates volatility is coming soon. My guess is that it will head north very soon. The weekly chart shows that this is week 6 of sideways action, the weekly MACD looking for all the world like a bullish cross is imminent, the rsi is in oversold territory and is heading up. The sotachstics have also rolled up...... Could be time for a punt here methinks IMHO. Daily and weekly charts looks like this.. Cheers and good luck to all holders
TNG Price at posting:
0.0¢ Sentiment: Buy Disclosure: Not Held