From a more technical perspective the chart looks ready to break down.
For those who "don't do charts" here is a link that explains it all. the picture can't get much more grim than this IMO.....
http://stockcharts.com/school/doku.php?id=chart_school:chart_analysis:chart_patterns:descending_triangle_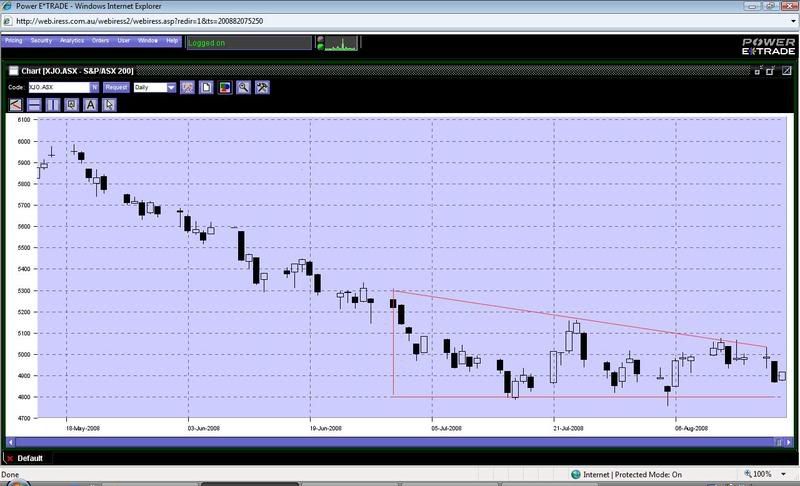
From a more technical perspective the chart looks ready to break...
-
- There are more pages in this discussion • 12 more messages in this thread...


You’re viewing a single post only. To view the entire thread just sign in or Join Now (FREE)