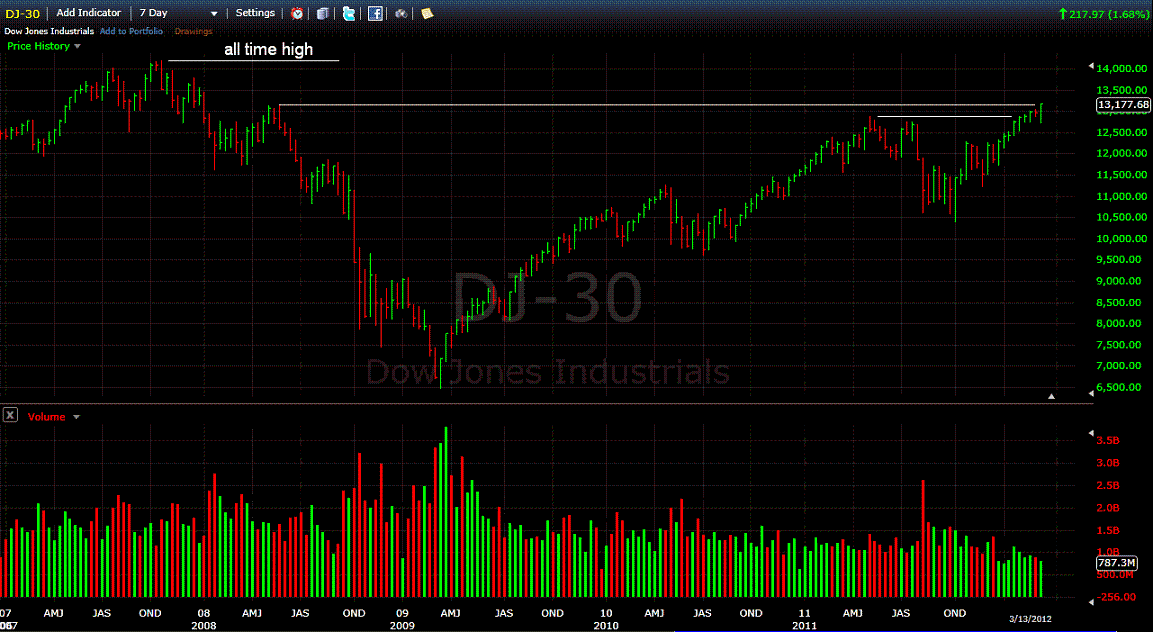
"..highs are generally formed on high volume......as lows are generally formed on low volume....."
sck, yes mate thats true but of course you could add further to it
Highs/tops can be formed on equally both high (distribution/supply) and low volumes (no demand after distribution),
as well Lows can be exactly the same, that being they can be formed on climatic action (possible start of accumulation/high volume)
and/or Low volumes (no supply/testing for anymore supply)
confused :)
Also like to add we all know that just because a rally (as we are at present) may be going up on less volume,
it doesn't mean it's all over red rover cause simply the DEMAND may turn up in the next period.
Chart below is a 7day period but with only 6days of volume (don't ask me why), therefore all it needs is another slightly
above average volume day and that live bar will EXCEED the volumes of the previous 4, meaning at present its seen as Bullish.
- Forums
- ASX - By Stock
- XJO
- trading inside wednesday
trading inside wednesday, page-38
-
- There are more pages in this discussion • 109 more messages in this thread...
You’re viewing a single post only. To view the entire thread just sign in or Join Now (FREE)
Featured News
Add XJO (ASX) to my watchlist
 (20min delay) (20min delay)
|
|||||
|
Last
7,959.3 |
Change
69.700(0.88%) |
Mkt cap ! n/a | |||
| Open | High | Low |
| 7,889.6 | 7,969.1 | 7,889.0 |
Featured News
| XJO (ASX) Chart |


