I think the Bow chart is looking good for another significant leg to the upside, following a multi week pullback.
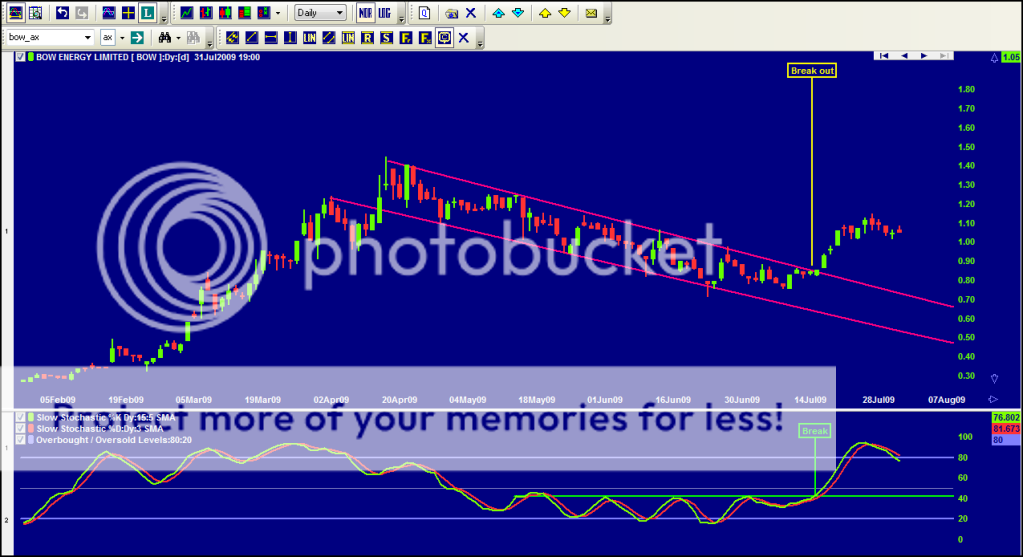
The above daily chart shows that Bow has recently broken out from a down trending channel....The break has lead to some nice percentage gains.
But any pull back in my view will be temporary and should be treated as a buying opportunity, as i think this has alot more in it.
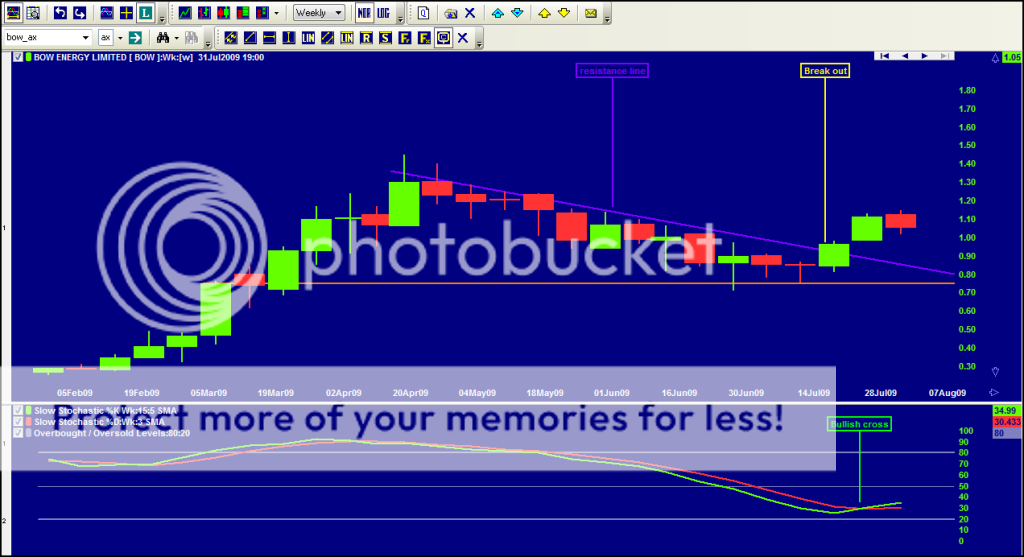
Here is a weekly chart illustrating the break out and why i feel that there are further gains to come.
* Note the Triangle break out on the weekly chart following a muti week pullback.
* Weekly stochastics have recently made a bullish cross up from an almost oversold position suggesting that this has the momentum to stage a multi week rally.
* On its most recent leg up which started late january Bow increased from a low of 25 cents and staged a multi week rally which took it to 1.45.....the recent pull back to 71 cents coincided exactly with the 61.8% fib retracement level of the run.
This suggests that the recent pullback in bow has been technically very normal, and has alleviated previously overbought conditions on the momentum indicators.
* The MACD has recently crossed back up and is above the 0 line, also suggesting that momentum is firmly to the upside.
* The 20 Period MA has just crossed up through the 50 MA which is also signalling that momentum is now to the upside.
I think this is a good place to get long on BOW - If the muti week rally that the charts are projecting plays out i have a target of around 2.10 on Bow.
Recent rotation of cash back into the CSG sector and the resulting strong gains recently of peers such as LNG,ESG,CNX,MEO and others as well as continued media spot light on the sector all bodes well for BOW.
Very exciting company - Good luck to holders!!
I think the Bow chart is looking good for another significant...


Add to My Watchlist
What is My Watchlist?