Danube, at the risk of Gann jumping in and telling me that there is a 20 year cycle etc etc....which there also is.....have a look at this chart below.
It seems that the economy in the US moves up for 17years and then sideways for 17. The channel for the sideways bear is very wide which allows for some mighty fine cyclical bulls and even all time highs. But the new highs don't last very long and it's back to the bottom of the channel where we nearly are now. Very scarey when you are living through it but it all looks very natural on the charts.
the charts a bit old but saves me redoing it and you get the picture.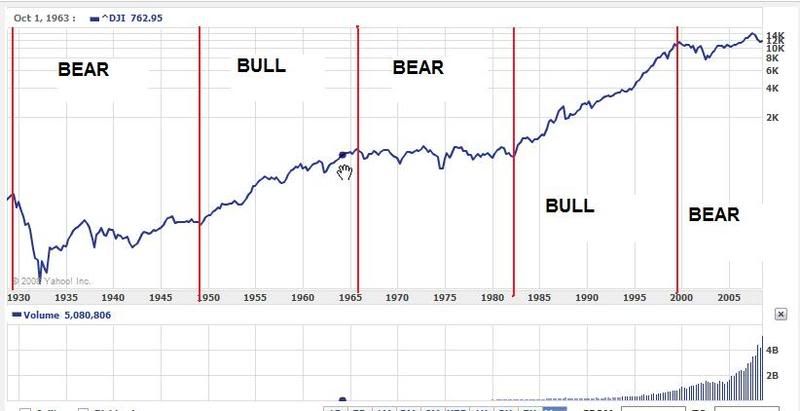
tuesday continues relief rally or not, page-49


Add XJO (ASX) to my watchlist
 (20min delay) (20min delay)
|
|||||
|
Last
8,211.3 |
Change
-11.700(0.14%) |
Mkt cap ! n/a | |||
| Open | High | Low |
| 8,223.0 | 8,223.0 | 8,200.0 |
| XJO (ASX) Chart |