M'kay, Coffeed up n raring to go.
Firstly recap on daily timespan
Daily
On this chart, we can see price recently bounced off the 21 period moving average.
In the approach to the moving average, a MACD Moving average Cross over occurred, oft touted as a bearish signal, and the stochastics zipped below the 50 percent mark.
Currently though, both these indicators are at levels where a bounce or continuation of a trend can continue (in this case the current trend is up... based purely on the MACDMoving averages being above the zero line). and the MACD signal line (fast, blue) is flattening and hinting a turn up to greet the slow (red) line.
the decline of price over the last 10 or so trading days has pretty much been in a shallow channel, not a waterfall panic sell off.
Just looking at the last 10 day decline, I would be more inclined towards upside rather than down at ths stage.
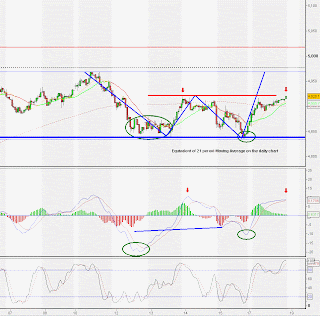
Taking a look at a timespan I don't normally use but it shows some nice stuff... The 4 Hourly...
In my opinion, we have two choices here, we are either in a range, trading between the red line sgment and the thin blue horizontal line below it, or we are in a greater range between the two thin horizontal lines.
A break above the red segment, and I suspect that the marked out pattern (thick blue segments) cound unfold, an intra trend W bottom, or "triangle trade".
These fellahs can be quite nice to the upside, often adding a couple of extra points above the top of the range.
Note however on this timespan that the stochastics are hard up into the oversold levels, and the MACD moving averages are at a critical time, about to bracket the histogram on the zero ine, potentially giving some clue as to short term outlook.
Popping down to the hourly
First thing of note here is that the approach to the upper part of the smaller range (between red line and recent lows), momentum appears to be trailing off.
this last bunch of candles is from the night session whilst the US Markets were on holidays. Makes it a little difficult to call, but certainly price is not "powering" to the upside.. yet.
The stochastic has also just tipped down within a very high overbought area.
Of importance to potential upside though, is that as yet the MACD moving averages are less extreme above the zero line than they were when the marked (ellipsed) turn signals for upside occurred. The concept of extremes on either side of the zero line appears to be important for signals on this indicator.
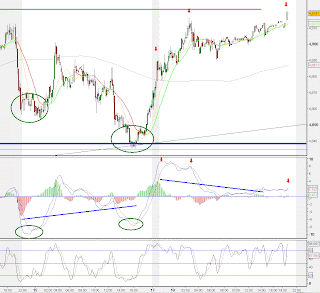
'Kay a final zoom down to the 10 minute.
MMMmmmmmm...
Suspicous.
As marked by the little red arrows, on this timespan divergence of price versus the MACD moving averages is quite marked, and Histogram divergence has occured since before the previous days close.
based on this alone, I would suspect that at least our initial moves are more likely to be downwards on or around open.
The usual caveat of caution on low timespan signals on overnight action applies.
Personally, If I had to make a decision here, I would be inclined to be short from open, and see how that pans out... referring back to the higher timespans though, a break through that red segmented level and next stop, double top potential.
;)
Add to My Watchlist
What is My Watchlist?


