Ahoy there XJOers,
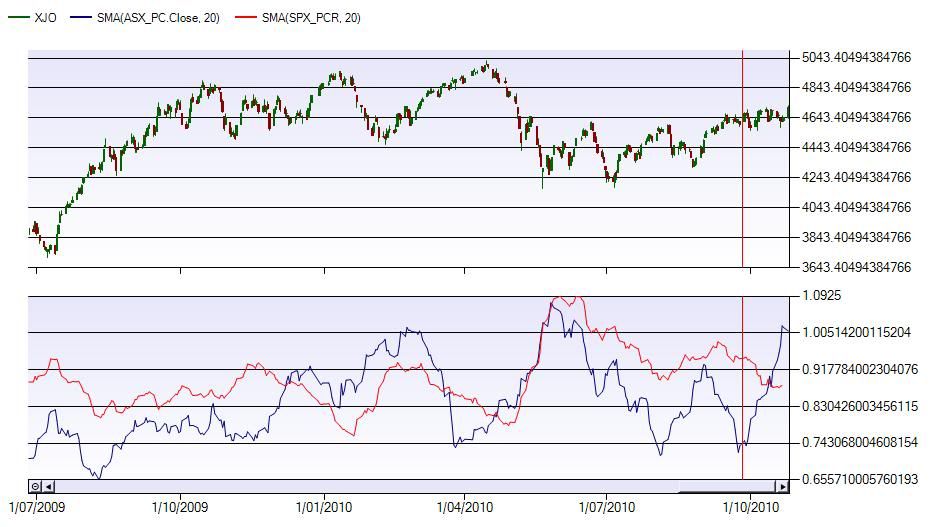
I thought the XJO close on Friday reaked of short covering, so I have looked at the put/call ratios (PCR) of ours and the US markets. I thought it was quite interesting, because our PCR seems to be at a top (lots of shorts), and the US markets at a bottom (lots of longs). What this is telling me is that the XJO could rally here as the US (and probably Europe) falls (or perhaps goes sideways).
So heres the chart of XJO, 20-day SMA of PCR's - XJO in blue, US in red...

You can see how the puts (shorts) were accumulated thick and fast when our market was going sideways in the last 5 weeks - by the blue line rising. The US and European markets have rallied in that same period, and the US market has been slowly accumulating calls (longs) - seen by the red line falling.
So, yesterdays rally might not be a once off. It didn't really put a big dent in the XJO PCR, so I think it needs to rally another 100-200 points to flush out the shorts, and it could be a divergence from weaker US/Europe markets.
Add to My Watchlist
What is My Watchlist?


