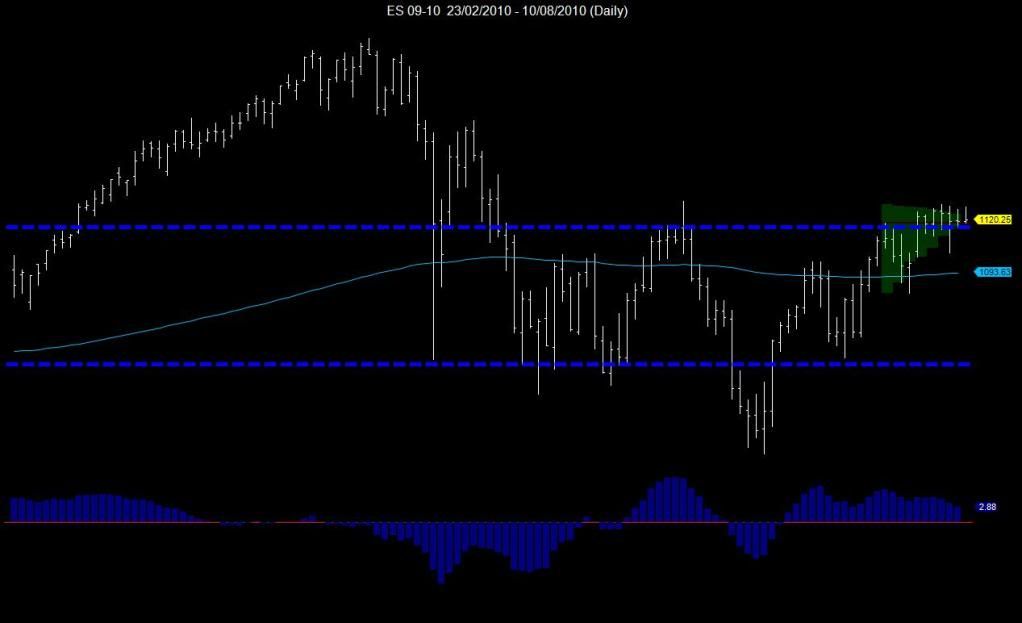
Emimi S&P 500, a daily chart with I hope shows the relationship between the 2 dimensions of the market .
The 200 day moving average sits at 1093 according to this data, and in my view represents the current value of that index. It's bouncumg allong the top of the trading bracket and if it breks down into it I'd expcet it to trade at the average.Where going to know where it's likely to go after the Fed speaks tonight perhaps.good luck and good trading.
- Forums
- ASX - By Stock
- tuesdays direction
Emimi S&P 500, a daily chart with I hope shows the relationship...
Featured News
Add XJO (ASX) to my watchlist
 (20min delay) (20min delay)
|
|||||
|
Last
8,009.1 |
Change
26.700(0.33%) |
Mkt cap ! n/a | |||
| Open | High | Low |
| 7,982.4 | 8,030.3 | 7,982.4 |
Featured News
| XJO (ASX) Chart |


