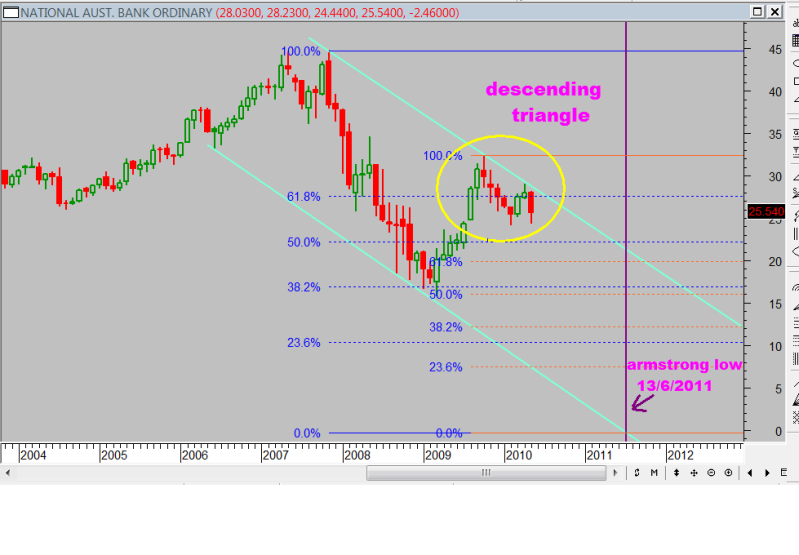
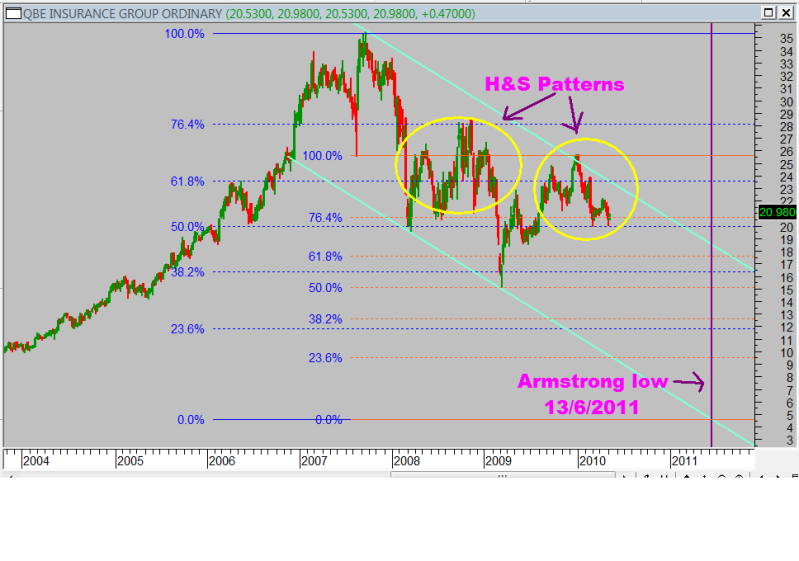
Ok, I am the first one to admit I may, or may not, have too much time on my hands....but I am having a look forward to some armageddon scenarios. I have 2 charts below, one for NAB and one for QBE, and I am marvelling at the fibonacci relationships in both price and time with respect to the comming armstrong low next year. I have already posted a fair bit on the time relationships already but a recap....
from the 6/3/09 market low (venus retrograde) to the recent US market high (Pesavento P date 25/4/2010) was 415 days....there will be that many days also back down to the armstrong low on 13/6/2010. Also the first leg down from 11/10/2007 was 512 days
512 x 0.5 = 415 x 0.618
also within this coming leg down we have another venus retrograde on 8/10/2010 and an earth mars opposition on 23/2/2011. These 2 astro events last time coincided with the market low and the jan 09 high. There are 150% time extensions hell west and crooked through those dates but you do the math for yourself lest you facially glaze over then skim over my post.
now to price....have a look at the parallel channels from the top of the market....assuming the time relationships were to play out AND the low resulted in a panic sell off the channel bottom then we also have some very interesting fib relationships. The first leg down (11/10/07 - 06/03/2009)represents 61.8% of the total move down to 13/11/2011 and the bull run we have just had would be exactly 50% of the coming fall.
Also looking at the current chart patterns both stocks look ominous atm....I know many here give little creedence to patterns by themselves but give both patterns are near the top of their respective channels and the horrible situation we have in major currencies one can't help but be a bit concerned. If these patterns break we could be back to march 2009 levels within weeks....and that may be the first wave only.
when it is all said and done by mid next year QBE could be bought for $4.50 and poor ol' NAB would be zero.....the collapse of a major bank in the coming year is not out of the question....however QBE is largely in cash. They have a history of shrewd purchases and all going well I wonder if they may not be the next millionaire maker in the next cycle up later in the decade.
I know Voltaire has mid 2013 as an ultimate low and I don't deny that could happen but as I said once before...9 out of the last 10 armstrong cycles were raging bulls in the first 26 months off the low.
- Forums
- ASX - By Stock
- XJO
- turbulent tuesday
turbulent tuesday, page-19
-
- There are more pages in this discussion • 81 more messages in this thread...
You’re viewing a single post only. To view the entire thread just sign in or Join Now (FREE)
Featured News
Add XJO (ASX) to my watchlist
 (20min delay) (20min delay)
|
|||||
|
Last
8,132.4 |
Change
-32.200(0.39%) |
Mkt cap ! n/a | |||
| Open | High | Low |
| 8,164.6 | 8,165.1 | 8,113.4 |
Featured News
| XJO (ASX) Chart |


