DABRU,
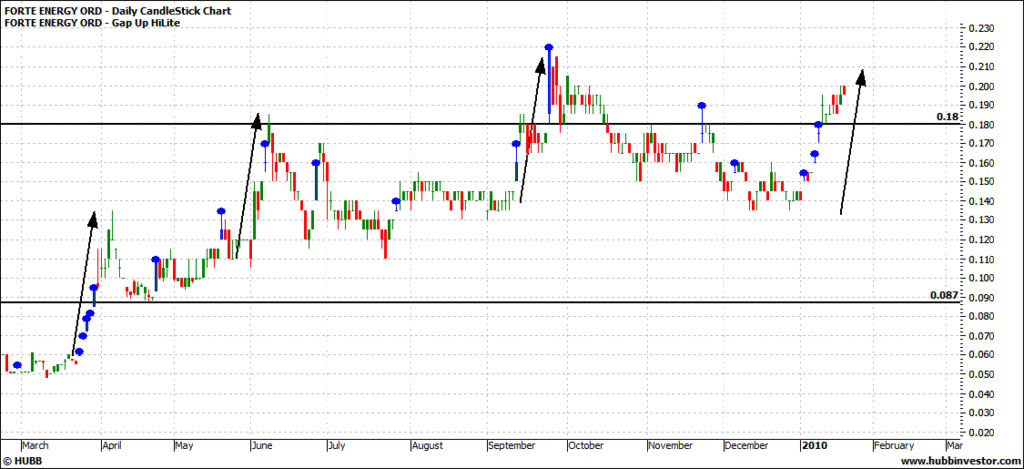
Here's an updated chart to the one I posted on 12/1. The comments are the same.
On the chart the blue dots represent gaps up.
In late March there were 5 consecutive gaps up which never got filled. All but one of successive gaps were filled.
Now we've had 3 gap ups and "the possibility that we've seen the teens for the last time."
Contrary opinions welcomed.
Can anyone remember what drove it in late March?
Cheers,
10cents

Add to My Watchlist
What is My Watchlist?


