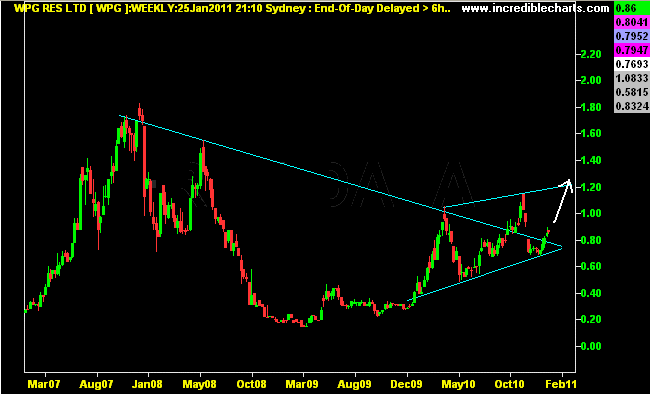
updated chart, 27/01/2011

  1. 13,097 Posts.
    lightbulb Created with Sketch. 236
    Looking great today and the weekly chart shows a breakout from the downward channel line that's formed throughout the last 4 years.

    Weekly stochastics and macd turning up or very close to doing so.

    First price target is $1.20.

    Needs to break through the wall between 90-92c, which is also the 38.2% Fib retracement from the previous top at $1.14.
 
Add to My Watchlist
What is My Watchlist?
A personalised tool to help users track selected stocks. Delivering real-time notifications on price updates, announcements, and performance stats on each to help make informed investment decisions.

Currently unlisted public company.

arrow-down-2 Created with Sketch. arrow-down-2 Created with Sketch.