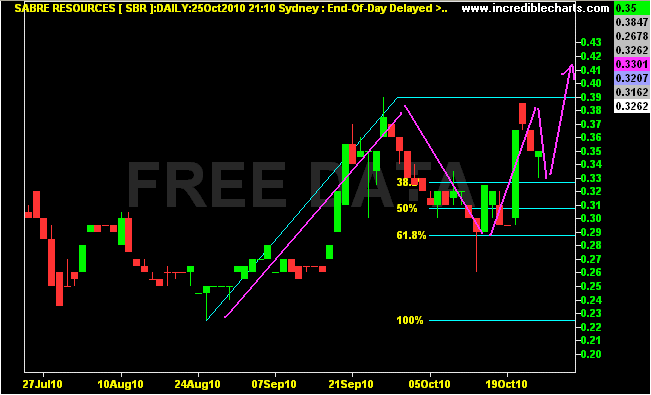
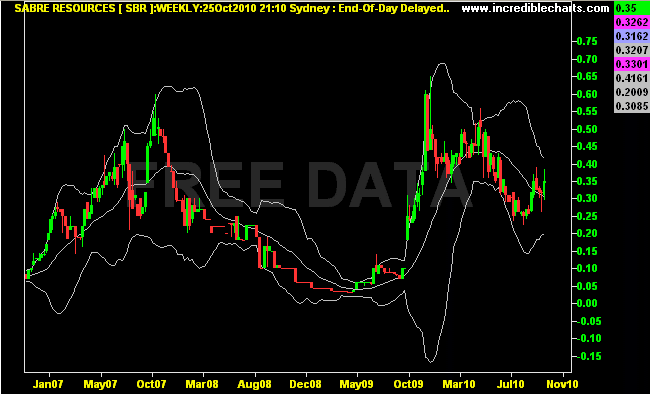
The chart is looking excellent for Sabre and with (potential) high grade diamond drilling results due to arrive soon, why wouldn't it! Expecting a lot more late money to come into this one considering the market knows they've got the rig up the hill and are boring down.
Putting the fibonacci retracements under the microscope, we can see the initial surge from 22.5 to 39c. Price then retraced to the 61.8% level (29c close) before surging again when Sabre announced drilling had commenced (38.5c). In the last few days, we've had a light retrace however this time only retracing to 38.2%, i.e. less hands and prepared to part with their shares as each subsequent retrace takes place.
Yesterday's long-tailed candle would suggest 33c is the bottom and the final pink arrow on the chart is the projected outcome.
I would expect 39c to be broken PRIOR to the next announcement, as traders and investors alike gear themselves up for the massive upside potential of high-grade copper cores being pulled at Kaskara.
On the weekly chart, the Bollinger bands are beautifully contracted, indicating high volatility and an imminent breakout.
- Forums
- ASX - By Stock
- updated chart
The chart is looking excellent for Sabre and with (potential)...
-
-
- There are more pages in this discussion • 20 more messages in this thread...
You’re viewing a single post only. To view the entire thread just sign in or Join Now (FREE)
Featured News
Add SBR (ASX) to my watchlist
 (20min delay) (20min delay)
|
|||||
|
Last
1.1¢ |
Change
0.000(0.00%) |
Mkt cap ! $4.322M | |||
| Open | High | Low | Value | Volume |
| 1.1¢ | 1.1¢ | 1.1¢ | $3.087K | 280.6K |
Buyers (Bids)
| No. | Vol. | Price($) |
|---|---|---|
| 5 | 538649 | 1.1¢ |
Sellers (Offers)
| Price($) | Vol. | No. |
|---|---|---|
| 1.2¢ | 796042 | 2 |
View Market Depth
| No. | Vol. | Price($) |
|---|---|---|
| 5 | 538649 | 0.011 |
| 18 | 2485923 | 0.010 |
| 4 | 555666 | 0.009 |
| 3 | 595000 | 0.008 |
| 1 | 200000 | 0.007 |
| Price($) | Vol. | No. |
|---|---|---|
| 0.012 | 796042 | 2 |
| 0.013 | 352727 | 2 |
| 0.014 | 725927 | 5 |
| 0.015 | 585000 | 2 |
| 0.018 | 447001 | 2 |
| Last trade - 15.47pm 13/11/2024 (20 minute delay) ? |
Featured News
| SBR (ASX) Chart |
The Watchlist
NUZ
NEURIZON THERAPEUTICS LIMITED
Michael Thurn, CEO & MD
Michael Thurn
CEO & MD
SPONSORED BY The Market Online


