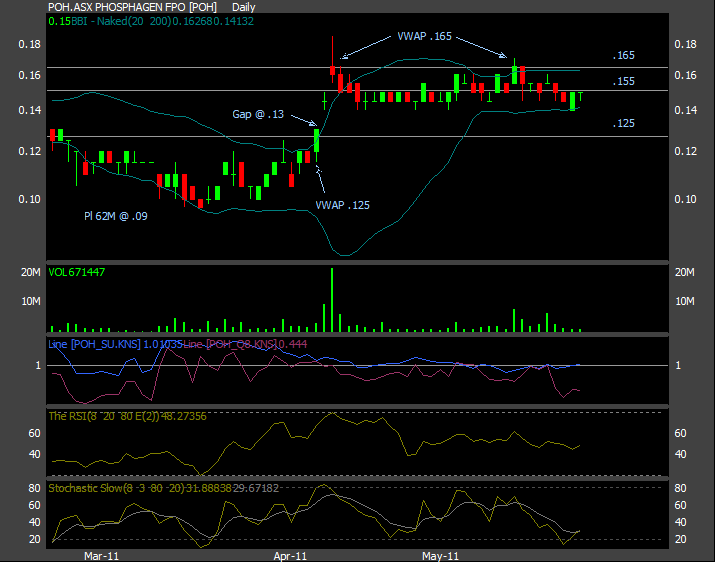
Unfortunately not much has happened since my last chart post - we are still firmly stuck in a trading range.
Some points:
I have drawn three lines on the price chart.
The .165 line represents the current resistance at the top of the trading range (notably the VWAP for the two highest volume days was at .165).
The .155 line is the current average price within the range.
The .125 line represents a potential support line if the sellers get a bit overzealous. There is a gap at .13 which
could get filled even though it looks to me like a breakaway gap. If it does get filled then the VWAP for the day prior to the gap was .125, hence this could be the low.
The two indicators below the volume bars are Neilsen Indicators based on depth data.
The blue line (Smart Money) represents the size of the parcels of the buy and sell orders. So when the blue line is above the horizontal line the buyers are taking bigger parcels and vice versa. As you can see this indicator is pretty steady meaning the buyers and sellers are fairly evenly matched in terms of parcel size.
The pink line (Supply/Demand) is simply the ratio of the total number of buys and sells in the first 8 lines of the depth queue.
This shows that for most of the recent trading range, the sellers have had the greater volume in the depth queue. In particular they came in pretty strongly on Tuesday and Wednesday, and then eased off a bit.
I'll be watching these indicators closely, for clues as to the next price direction, but at the moment, from a trading perspective there is little here to interest me.
I'd be happy to jump on if the price clears .165 on good volume but will also look at the worst case scenario and be ready for a buy at .13 or .125
Hope for you guys it's the former.
- Forums
- ASX - By Stock
- updated chart
Unfortunately not much has happened since my last chart post -...
Featured News
Add AVE (ASX) to my watchlist
 (20min delay) (20min delay)
|
|||||
|
Last
0.3¢ |
Change
0.000(0.00%) |
Mkt cap ! $9.508M | |||
| Open | High | Low | Value | Volume |
| 0.3¢ | 0.3¢ | 0.3¢ | $7.098K | 2.788M |
Buyers (Bids)
| No. | Vol. | Price($) |
|---|---|---|
| 48 | 95299175 | 0.2¢ |
Sellers (Offers)
| Price($) | Vol. | No. |
|---|---|---|
| 0.3¢ | 20889253 | 12 |
View Market Depth
| No. | Vol. | Price($) |
|---|---|---|
| 48 | 95299175 | 0.002 |
| 15 | 63272009 | 0.001 |
| 0 | 0 | 0.000 |
| 0 | 0 | 0.000 |
| 0 | 0 | 0.000 |
| Price($) | Vol. | No. |
|---|---|---|
| 0.003 | 20589253 | 11 |
| 0.004 | 25596497 | 22 |
| 0.005 | 38768198 | 21 |
| 0.006 | 21092339 | 13 |
| 0.007 | 9365221 | 8 |
| Last trade - 15.43pm 20/06/2024 (20 minute delay) ? |
Featured News
| AVE (ASX) Chart |
The Watchlist
HAR
HARANGA RESOURCES LIMITED.
Peter Batten, MD
Peter Batten
MD
Previous Video
Next Video
SPONSORED BY The Market Online


