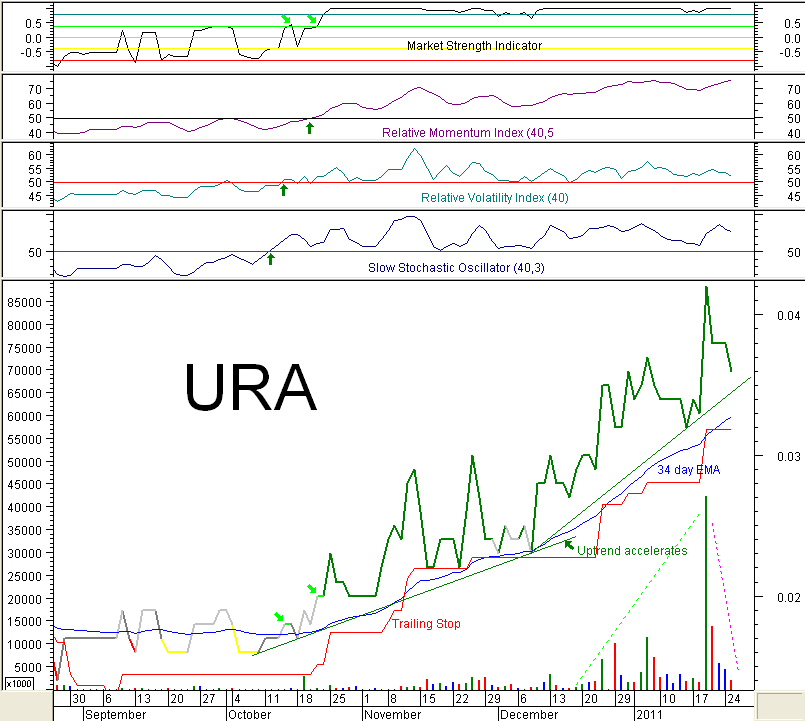
Here is a selection of half a dozen indicators that gave good entry signals into URA and should also provide useful Sell signals when the time comes.
Note the rising volume (green dotted line) when URA was in a short-term uptrend. This is Bullish. Note the falling volume (magenta dotted line) while URA is in its current short-term downtrend. This too is Bullish. See how the underlying "medium-term" uptrend is still intact, and has in fact accelerated.
See how the MSI Buy signals were no better than any of the conventional indicators shown here. Its sole advantage is that there is no need to select a time period appropriate to the stock in question.

Add to My Watchlist
What is My Watchlist?


