This run seems to have some more steam in it at present - but is approaching a critical juncture.
This prompted me to look outside the square for any hints of future movement - ending up with the volatility index for both the XJO and SPX.
This post is theory based only and is intended to provoke thoughts on possible upcoming scenarios. The VIX is used in the diagrams below but it must be noted that the VXO has the same technical setup. The VXO index is considered a more accurate modern day indicator than the better know VIX index.
Volatility indexes usually recede after a spike for a period of time. This post is focusing on the possibility that the pullback and anticipated advance is accelerated as per the norm. It is quite reasonable for volatility to fade and for these charts to wither and not pan out.
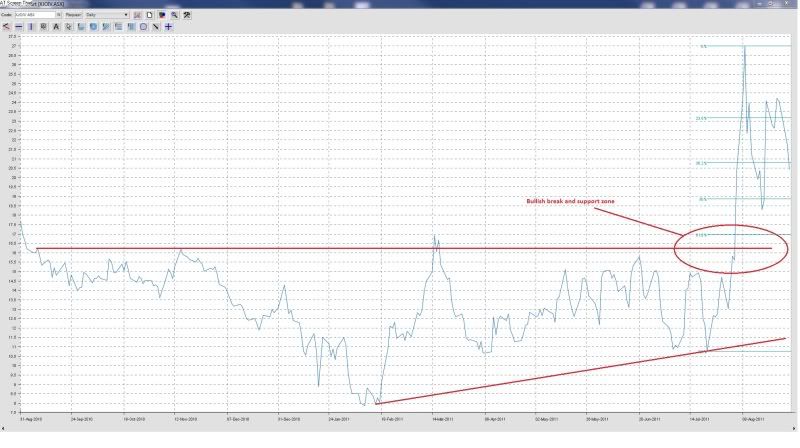
XJOIV daily: Recent bullish rising pennant was a key to the latest selloff. A 61.8% pull back will coincide with a neat test of the old resistance levels around 16.5/17. This could give an early warning signal a further selloff is approaching. Could still travel all the way back to the lower rising trend line and maintain its setup.
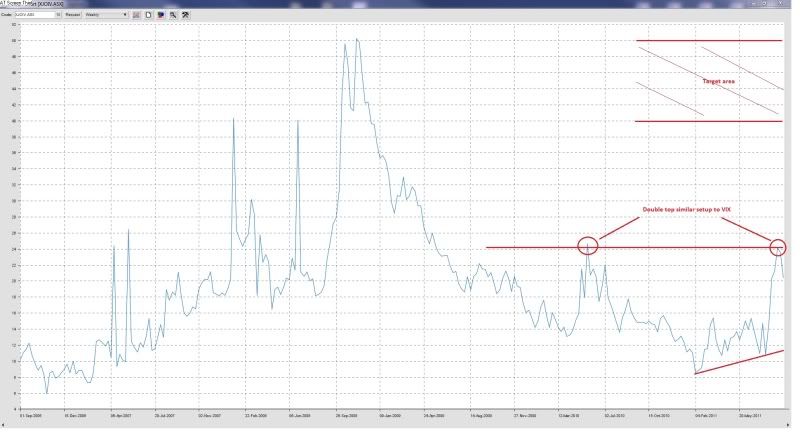
XJOIV weekly: Appears to have double topped @ 24 (similar to VIX index - see below) and is set to form a bullish pattern (higher lows). If the pattern plays out and 24 is taken out down the track then look for 40 -50. Still needs a further pull back to let off recent steam though (refer to XJOIV daily)
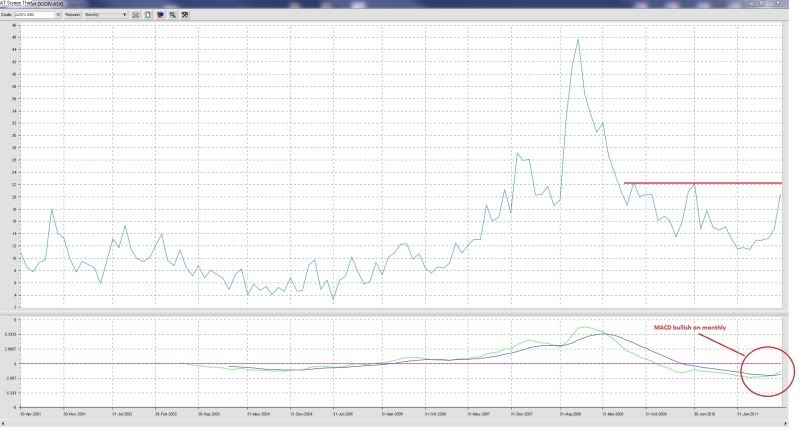
XJO monthly: MACD has given a bullish cross on the monthly, coinciding with the bullish chart setups on the daily/weekly.
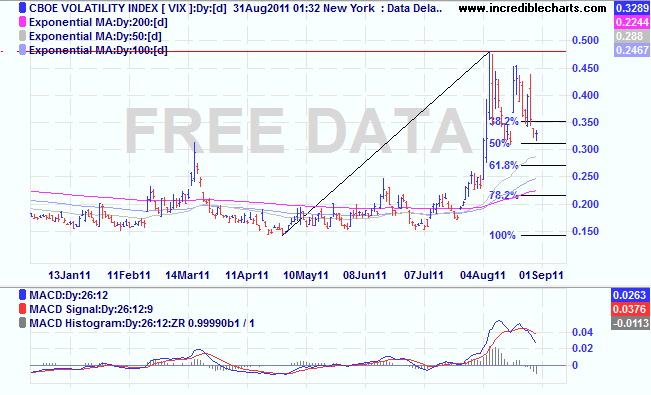
VIX short term: Interesting to note that the VIX has retreated and held a bullish 50% on two seperate occasions in the last few weeks after a pullback from a double top (similar pattern to XJOIV). It looks to be heading towards the 61.8% for a lower test at around 27. A break of 78.2% may see volatility fade out for the time being (as per historic moves).
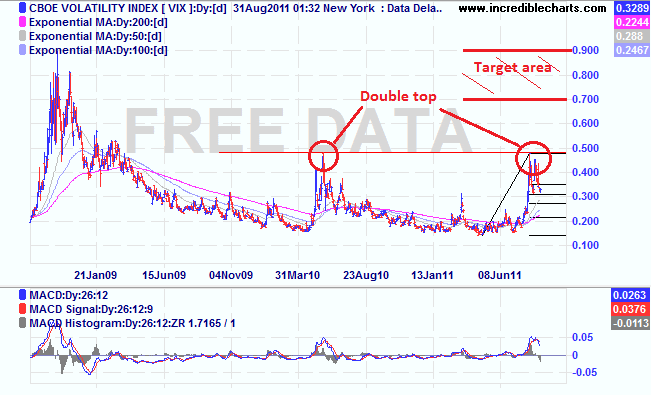
VIX double top: What caught my attention is the correlation between the XJOIV and VIX forming a similar technical pattern. Either the double top is exactly that, a 'double top' and volatility fades away, or these patterns are forming potential continuation patterns and a potential break of the double top will create large market selloffs and a violent spike in volatility.
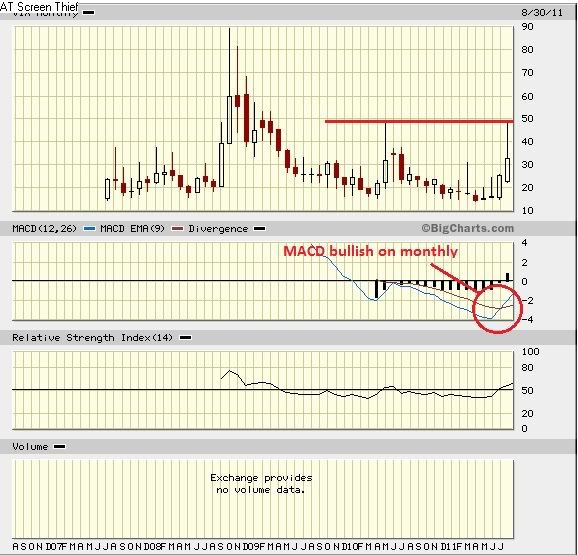
VIX monthly: Unfortunately, the monthly VIX chart also has a bullish MACD cross which may support the bullish daily/weekly setups.
Conclusion: If the volatility indexes are helping to guide the future (if only it was that easy) then we may be expecting to see a massive spike in volatility and a further selloff in stocks with a break of the double tops in both the XJOIV and VIX (similarly VXO).
With this in mind, I have a target of 3700 on the XJO and 1050 on the SPX as short/mid-term lower targets before volatility settles down again and gives us a welcome breather for a while.
Around 3700 will provide strong support for the XJO due to last month's 61.8% 2009 - 2011 pullback support and the additional multi-year trend line supporting the market.
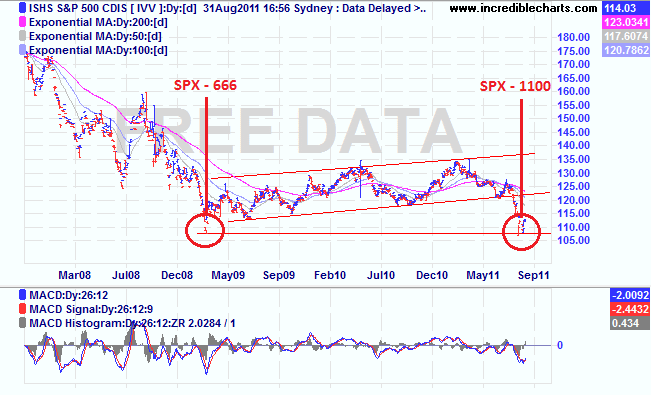
With the weak $USD the SPX should struggle to get below 1000. This is highlighted on the ETF AU:IVV chart below. The Australian market could have bought the SPX at the 2009 low equivalent during the August 2011 selloff. The new 1000 is the old 666 thanks to the stronger $AUD vs. weaker $USD.
Trade Safe!
Add to My Watchlist
What is My Watchlist?
