First up if anyone is interested, I've gone into some heavier stuff that may help to understand the deeper down workings of the Trading Range, not too much though.
Also further down we can have a look at today's action/chart and go into depth of what Phase we believe it is in as well as the weekly chart.
........
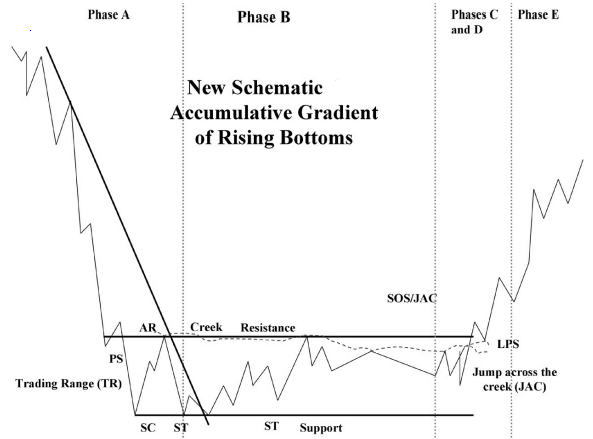
A post of last week by Inghamsa showed a trading range schematic that was the orginal and only one used by Wyckoff for accumulation.
While this basic model does not offer a schematic for all the possible variations in the anatomy of the TR, it does provide a good representation of the important Wyckoff principles, often evident in an area of accumulation, and the identifiable phases used to guide one's analysis through the TR toward the taking of a position.
A new additional schematic for accumulation was then developed a few years later, this has now filled the gap in Wyckoff schematics for accumulation and it's called 'Gradient of Rising Bottoms. mmm sounds interesting
In brief, there are currently two Schematics for distribution, but only one Schematic for accumulation. The new Schematic for Accumulation is a counterpart to the Schematic for Distribution that features descending price peaks.
Richard D. Wyckoff and his Associates time and again pointed out the power of ascending bottoms in a base of accumulation or re-accumulation. They also underscored on numerous occasions the efficiency of a pattern distribution composed of descending price peaks.
The logic for ascending bottoms amid descending peaks is rooted in the concept of the Composite operator (smart money/professional trader). Within a trading range the composite man is seen to accumulate a line of stock from the public who become especially frightened during the downthrusts. ahh run
The composite man is willing to play the short side of the market as well during the trading range of accumulation so long as he can abstract a public following of sellers.
But as the trading range proceeds, the new schematic reveals that fewer and fewer sellers remain to propel stocks downward in price. As a consequence, the downwaves become shorter and shorter in length (the bottoms rise ie. higher lows) and the Composite Man as a result accumulates an increasing line of stock.
Ultimately there is little left of sellers to coax to the downside and so the composite man reverses his attention and spurs prices upward and out of the trading range. A markup campaign now gets underway led by the composite man. rip rip
the new additional schematic for accumulation
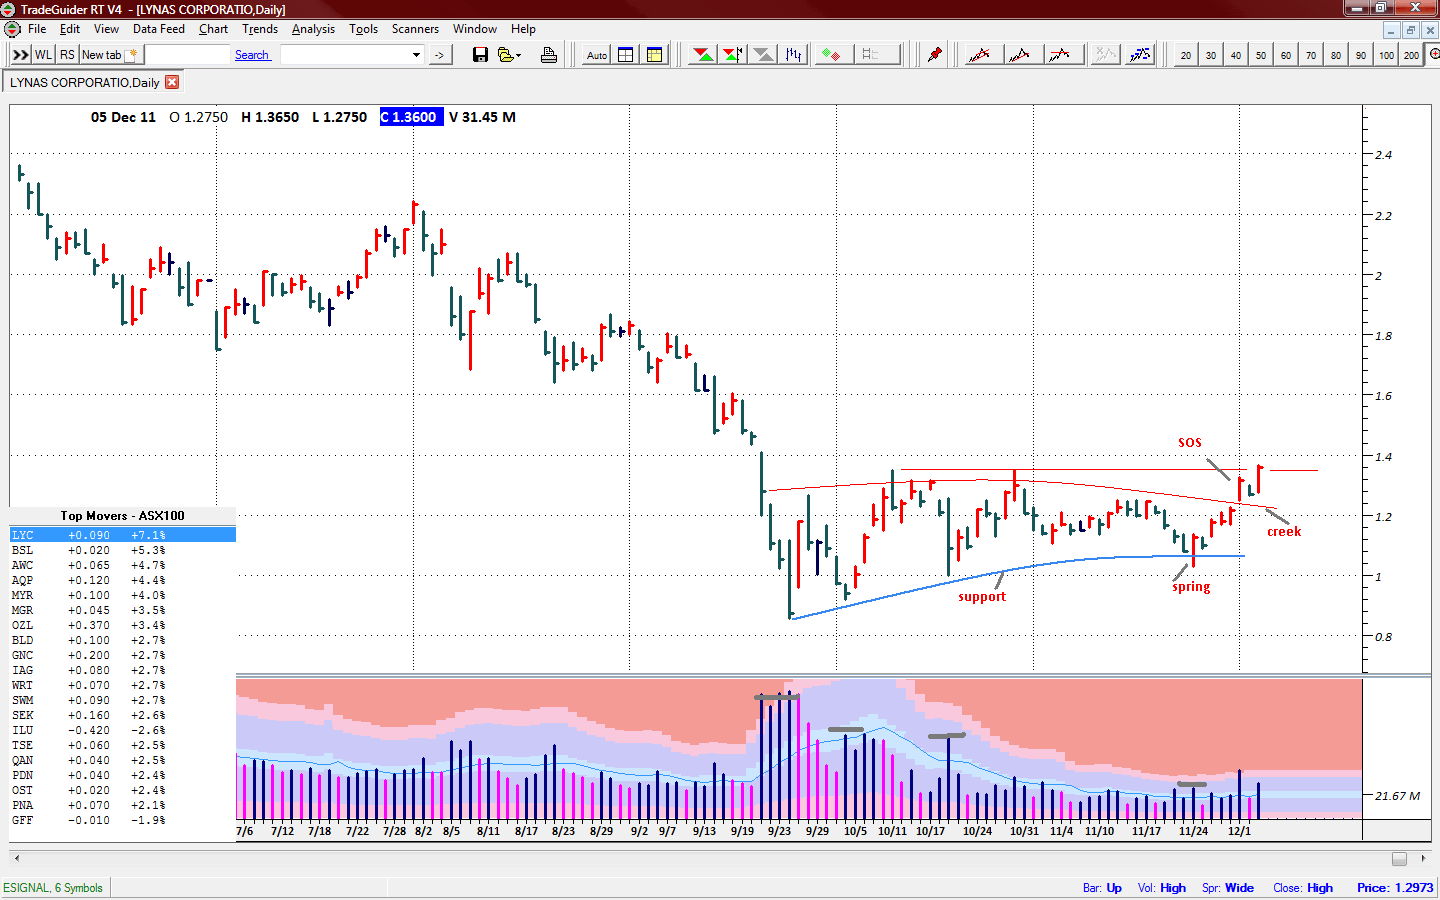
Just to summarize what should have happened in ‘Phase C, let’s start at the bottom with our spring/shakeout.
A ‘spring 24Dec is a price move below the support level of the trading range that quickly reverses and moves back into the range.
It is an example of a bear trap because the drop below support appears to signal resumption of the downtrend or maybe it was those traders that didn't understand fully what we meant by calling an 'Armageddon day'. ha ha
In reality, though, the drop marks the end of the downtrend, thus trapping late sellers, or bears.
The extent of supply, or the strength of the sellers, can be judged by the depth of the price move to the new lows and the relative level of volume in that penetration.
Until this testing process, you cannot be sure the TR is accumulation and hence you must wait to take a position until there is sufficient evidence that a markup is about to begin.
If we have waited and followed the TR closely, we have arrived at this point where we can be quite confident of the probable upmove.
With supply apparently exhausted and our danger point pinpointed, our likelihood of success is good.
The spring/shakeout that occurred 25Nov represented the first prescribed place to initiate a long position.
The secondary test that occurred the very next day is an even better spot to buy, since a low volume pullback and a specific low risk stop or danger point is just below the lows of the day before.
Now that we have ‘jumped the creek initial resistance level with a confirmed SOS and also a successful LPS 02Dec, we have now moved (we hope) into ‘Phase D which I will detail in depth later this week.
LYC day chart
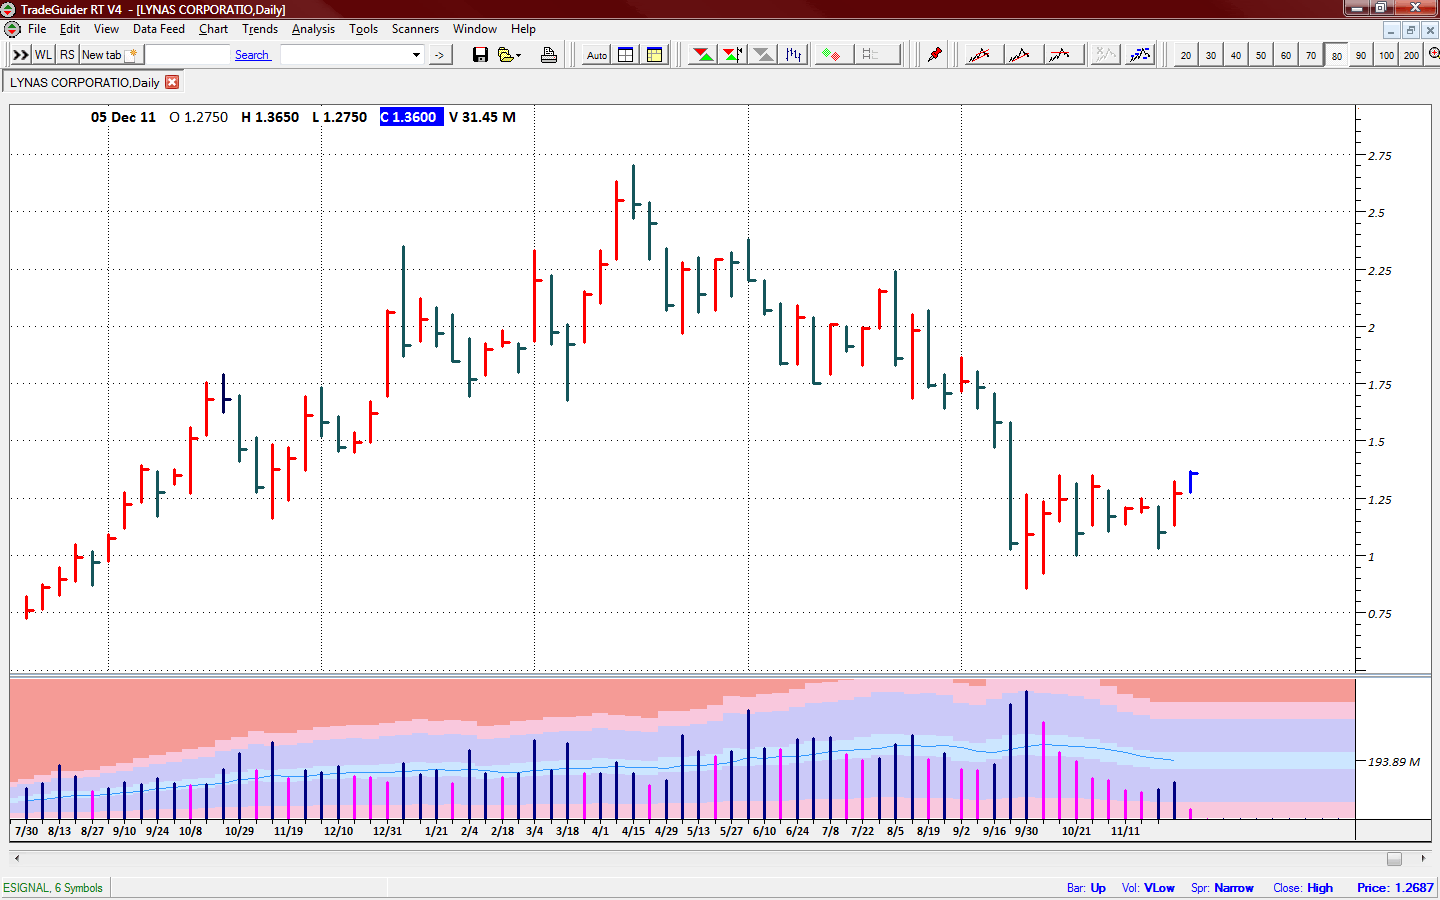
LYC weekly
bullish bar last week, increased volume/spread to the up
Not sure about everyone but, just like my car I like to try and fully understand what makes it go, what's under the bonnet, exactly the same as trying to understand the workings of the marketplace, and one good way of doing that is by following the guys that have done it before and all successfully for near 100years and treating it (as I do) as a fulltime job. Would you try and fully understand your job?
was that a sos week ta @ $1.27, page-27
-
- There are more pages in this discussion • 120 more messages in this thread...
You’re viewing a single post only. To view the entire thread just sign in or Join Now (FREE)
Featured News
Add LYC (ASX) to my watchlist
 (20min delay) (20min delay)
|
|||||
|
Last
$7.84 |
Change
-0.105(1.32%) |
Mkt cap ! $7.290B | |||
| Open | High | Low | Value | Volume |
| $7.78 | $7.85 | $7.70 | $9.522M | 1.224M |
Buyers (Bids)
| No. | Vol. | Price($) |
|---|---|---|
| 9 | 5908 | $7.83 |
Sellers (Offers)
| Price($) | Vol. | No. |
|---|---|---|
| $7.84 | 14497 | 20 |
View Market Depth
| No. | Vol. | Price($) |
|---|---|---|
| 29 | 8355 | 7.820 |
| 28 | 11648 | 7.810 |
| 17 | 31958 | 7.800 |
| 15 | 6391 | 7.790 |
| 8 | 11736 | 7.780 |
| Price($) | Vol. | No. |
|---|---|---|
| 7.830 | 4099 | 13 |
| 7.840 | 15227 | 21 |
| 7.850 | 31139 | 20 |
| 7.860 | 17234 | 12 |
| 7.870 | 11876 | 10 |
| Last trade - 13.26pm 05/11/2024 (20 minute delay) ? |
Featured News
| LYC (ASX) Chart |


