
- 39.48% had one
- 17.59% had two
- 8.36% had three or more
+ the investment of Woodson Capital Management. There's substantial confidence in SPT.
"Significantly, it has gained Woodson Capital as a substantial shareholder, the US investor which made a significant investment in Afterpay last year."
Source: disallowed/business/companies/no-covid-caution-as-splitit-raises-100m-for-global-expansion-20200805-p55ion.html
If you look at the stats below, avg cc purchase is usually higher than avg dc purchase... so a split payment offering would be appealing for people to manage immediate cashflow. And over the decades, the total spend on cc's has only gone one way: up.
Where individuals (who hold both cc's and dc's) are presented with a bnpl option - I would guess those who enjoy the perks of a cc will pick Splitit as they double dip on cashflow convenience plus earn points, security of included insurances like purchase protection, theft/damage and travel insurance, etc. Plus the universality of credit cards and safety net, esp for big spend holidays.
I imagine with wider adoption, cc companies may well cross-sell Splitit as a value prop, as it doesn't hurt them, and it only makes their product even more appealing. Once SPT has a strong customer base, who knows they might want to venture into dc bnpl after all and play in both markets. Probably not though as it breaks their current value prop apart.Australian credit card and debit card statistics 2020
Discover exactly how the average Australian uses their credit card with our comprehensive guide to credit card statistics.
UpdatedFeb 12, 2020
Fact checkedSource: https://www.finder.com.au/credit-cards/credit-card-statistics
There are 14,088,998 credit cards in Australia as of May 2020, nettinga national debt accruing interestof $23 billion. For many Australians, managing credit and debt through credit cards is a common element of their day-to-day money habits, while for others a few bad mistakes have resulted in a downward debt spiral. But what does the state of Australia's credit card debt actually look like?Australian credit and debit card statistics
Comparing how we use credit cards and debit cards
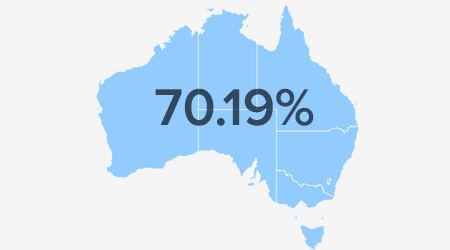
How many Australians have credit cards?According to the finder.com.au June 2016 survey,70.19%ofAustralian adults own a credit card.
Demographics
How many Australians own credit cards by age group?
18-35 - 65.07%
35-54 - 82.18%
- 34.70% had one
- 26.79% had two
- 20.69% had three or more
55+ - 79.84%
- 32.79% had one
- 29.53% had two
- 17.52% had three or more
How has the way Australians use credit cards changed over the years?
The table below depicts the average number of accounts per year, the total number of purchases and total purchase spend nationally, the average balance per card and the proportion of that balance accruing interest.