There's a bit of clutter on this chart to the unfamiliar eye but the levels I want to draw attention to are marked "1" and "2". The recent high (last Wednesday) on the continuous contract for the emini s&p futures has a direct hit on the 161.8% fib extension of the range from the October high to the November low. It shows the significance of this instrument and also suggests that looking at specific contracts might not be the way to go. Also note we're through the support tyne on Maxi's fork.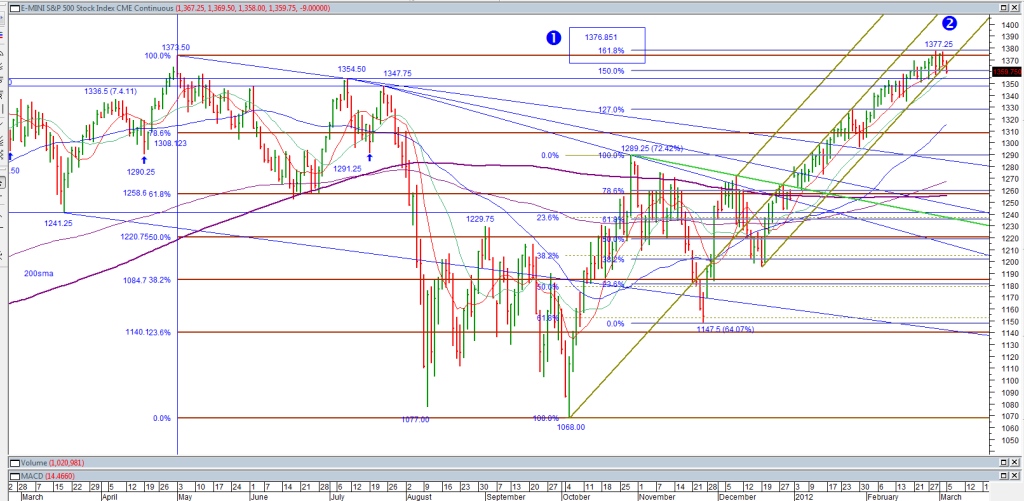


Add to My Watchlist
What is My Watchlist?
 (20min delay) (20min delay)
|
|||||
|
Last
8,757.2 |
Change
118.200(1.37%) |
Mkt cap ! n/a | |||
| Open | High | Low |
| 8,639.0 | 8,776.4 | 8,639.0 |
| XJO (ASX) Chart |