Great work wink, we are not worthy honestly... your MACD science is something else.
I don't know if this is concidence, but are we at a particular juncture? Hourly of the ASX200 (IGM) below.
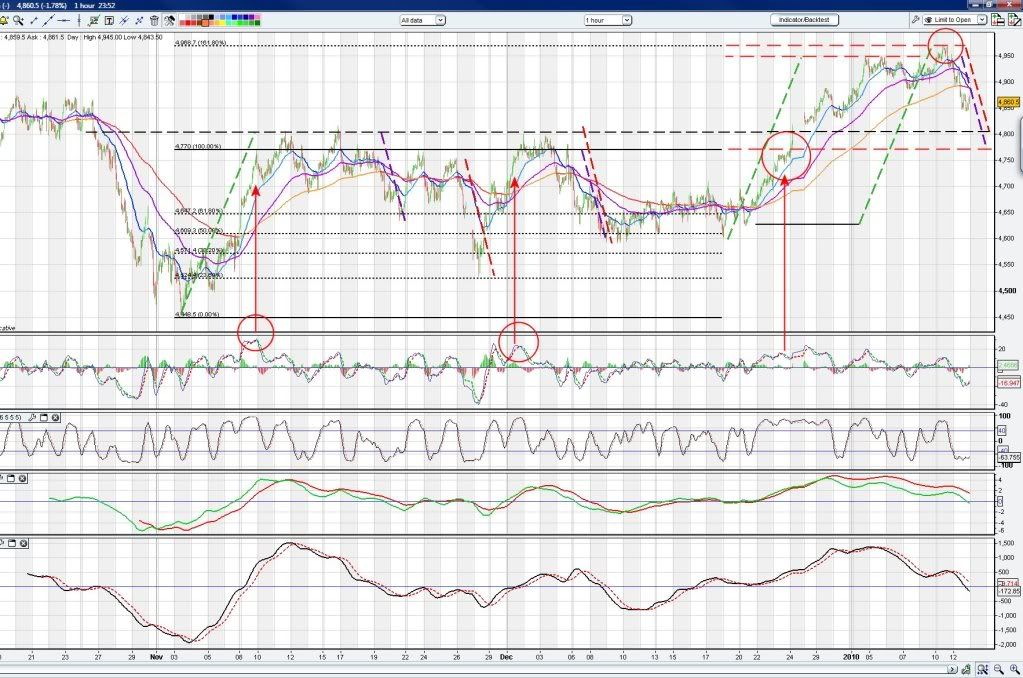
Using a bit of your MACD science I get the chart below -
Using Fibs from the low at 4448, and the first retest on max MACD at 4770 (red arrow), then another retest on max MACD (second arrow) then it broke through, but the MACD wasn't peaking this time (3rd arrow).
I can't count cycles, but oddly enough, this then peaked at the 161% Fib from 4770, 'just' shy of the 4969 50% GFC retracement Fib that I get from the XAO daily.
Doesn't something in Elliot waves say somthing about 1.6 times a wave A,B,C?? 1.6 must be the Fib projection then. (I don't know anything about Elliot and his waves). Does it suggest a retrace 5 wave count down?
Anyhow, if 4770 was a significant value back in October, since then our trading volume have tapered off - which could be a sign of accumulation having finished perhaps - people waiting to see something swing either way which would account for flat ranges since Sept09.
Don't forget though, indices are always using the best stocks of the time, and have dynamic constituents. This means less valued stocks have been discarded from last year.
Maybe this is a base for an upleg? If XAO closes below 4700 in Jan2010 I still plan on being out for a spell. Some of my equities are kicking up nicely, so will see which ones stay this way.
I don't plan on buying back into any equities that trigger sells until this gets a clearer direction.
rgds,
pw
ASX200 hourly
- Forums
- ASX - By Stock
- XJO
- wednesday trading
wednesday trading, page-10
-
-
- There are more pages in this discussion • 90 more messages in this thread...
You’re viewing a single post only. To view the entire thread just sign in or Join Now (FREE)
Featured News
Add XJO (ASX) to my watchlist
 (20min delay) (20min delay)
|
|||||
|
Last
8,212.2 |
Change
8.500(0.10%) |
Mkt cap ! n/a | |||
| Open | High | Low |
| 8,203.7 | 8,225.5 | 8,203.7 |
Featured News
| XJO (ASX) Chart |


