Lotsa questions....
Peter... it takes account of all historical and recent data or any subset I chose. The 17.1 yr cycle comes out as the strongest correlated over the last at least 2.5 years of price movements across the entire range and across most 6 month segments within that time as well
Danube, yes I can choose whether to use uptodate data or to omit recent data from the analysis. The todays chart was made with uptodate data but the 17 year cycle still comes out on top if I drop the last 6 months of data.
As new data comes in it has an effect of changing the future prediction by a 30% weighting since I only have 56 years of historical data and the cycle is 17 years long. The other thing to bear in mind is that I was previously posting a combined 17.1 and 17.08 year cycle as these are the two dominant ones and they have almost equal impact in the last couple of weeks however the 17.1 year cycle has begun to distinguish itself more.
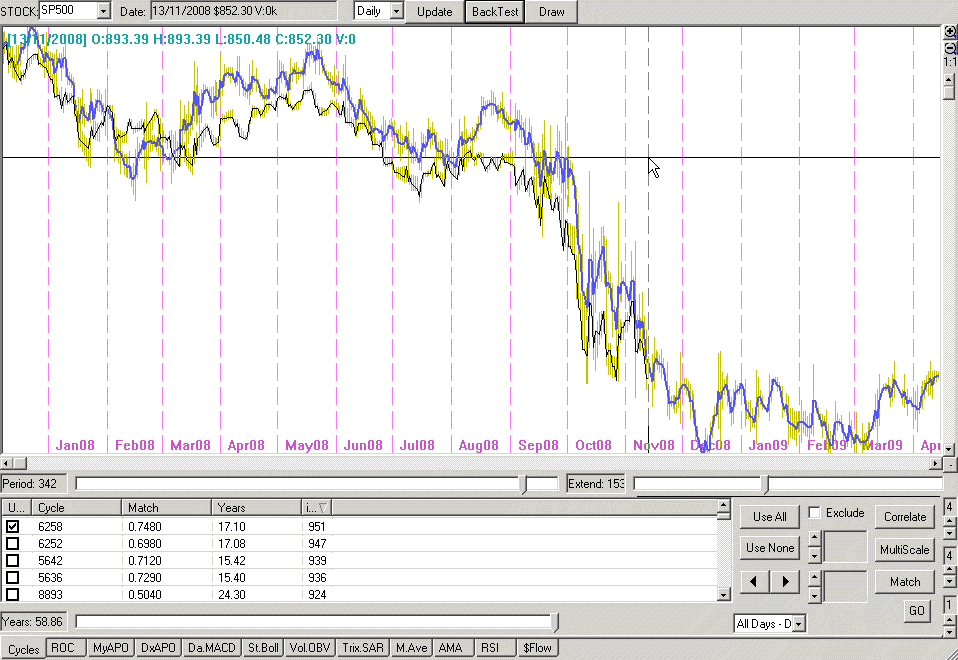
IF you look at this combined 17.1 & 17.08 chart I posted in september you'll see it was flat from november which was due to the 17.1 bottoming in mid Dec and the 17.08 bottoming in mid Jan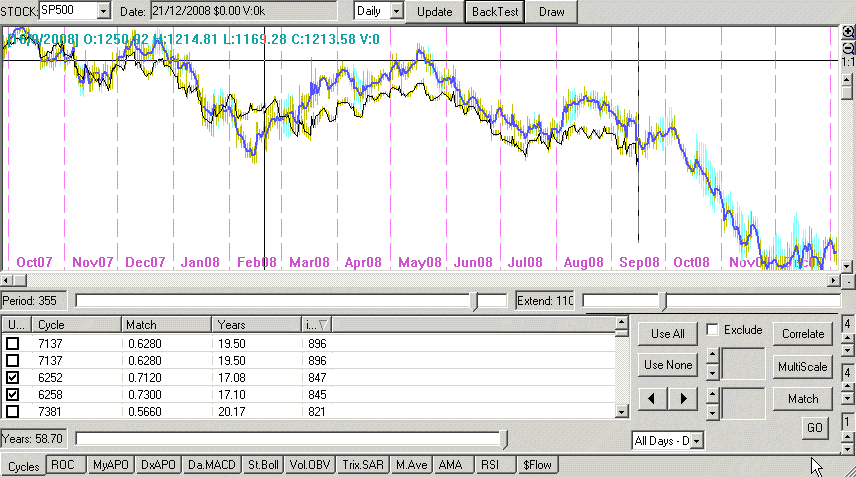
If you look at this other chart from mid Nov where I only had the 17.1 year cycle you will see that it is a little different in that the magniture of the rallies and falls are a bit bigger or smaller which means the final target values will be a little different although the major turn dates dont change too much.
sinvestor, it is homebrew and not currently available for purchase, maybe one day
atlunch. yes R values. No the next best is 17.08 but that did not come up because I chose a fairly short anaylsis window (so the plot would be not too dense) the 17.08 and 17.1 year cycles give best fit over a wide range of time scales.
chewy.. yes and no :)
Lotsa questions....Peter... it takes account of all historical...


Add XJO (ASX) to my watchlist
 (20min delay) (20min delay)
|
|||||
|
Last
8,202.9 |
Change
52.900(0.65%) |
Mkt cap ! n/a | |||
| Open | High | Low |
| 8,150.0 | 8,205.1 | 8,147.5 |
| XJO (ASX) Chart |