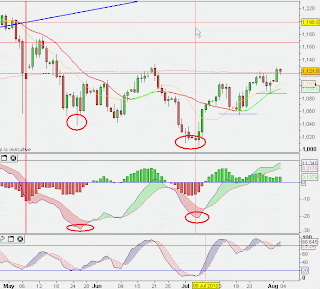
A couple of days ago I mentioned to another trader that I had seen an anomoly between the SPI and the SPX500, all based around the flash crash low on May 6th.
On the SPI, based on the daily
Momentum indicators DO NOT SHOW a buy signal on the daily, primarily as there was no lower low based on the flash crash low (left most circled low)
I have struggled with this a bit, with an EXPECTATION that we "need" to put in a lower low, round the 4100 ish mark or lower, n the case being that were said low to occur then it would be the back up the truck n load up on longs point, as I dont have indications on higher timespans that this is DEFINATELY (downside) nore than a correction...
All well and good for the intillectual pursuit of happiness, but in terms of not being long oriented for the last month is a bit of a pain no? LOL!
To show the difference in cleanliness of signals, and something that I am enjoying kicking myself over at the moment for not paying more attention to the US indices (which were active at the time of the flash crash (cash open in US) and so the crash data MAY bbe more significant for THOSE indices...
SPX500 daily
Look at that! blasted Daily Buy Signal As plain as the nose on yer face damit grrr :)))
Note on this chart I have marked a range (yeah I know a HUGE range, blame the flash crash) of the target area for price based on the histogram extremes on lefthand side of chart.
So the Flash Crash is still being a pain as it has given me two wide ranging levels of support/resistance to measure the upside move against, and we could conceivably be there now...
However again in retrospect of the daily, there are two things on the SPX500 chart which lend weight to upside not done yet .
Note price reaction to 200 ma (dotted thinred line on price)... first test fail, second test made it above, and now we test it as resistance... a bouunce from this newly tested resistance in certainly on the cards.
MACD mavs have NOT given an opposing Daily SELL signal (higher high on price, lower high on MACD moving averages) and the way this stuff works for me is that I look for these signals at either end of a trend on a specific timespan...
Something to think about eh?
;)
- Forums
- ASX - By Stock
- XJO
- wednesday
XJO
s&p/asx 200
Add to My Watchlist
1.37%
 !
8,757.2
wednesday, page-7
Featured News
Add to My Watchlist
What is My Watchlist?
A personalised tool to help users track selected stocks. Delivering real-time notifications on price updates, announcements, and performance stats on each to help make informed investment decisions.
 (20min delay) (20min delay)
|
|||||
|
Last
8,757.2 |
Change
118.200(1.37%) |
Mkt cap ! n/a | |||
| Open | High | Low |
| 8,639.0 | 8,776.4 | 8,639.0 |
Featured News
| XJO (ASX) Chart |


