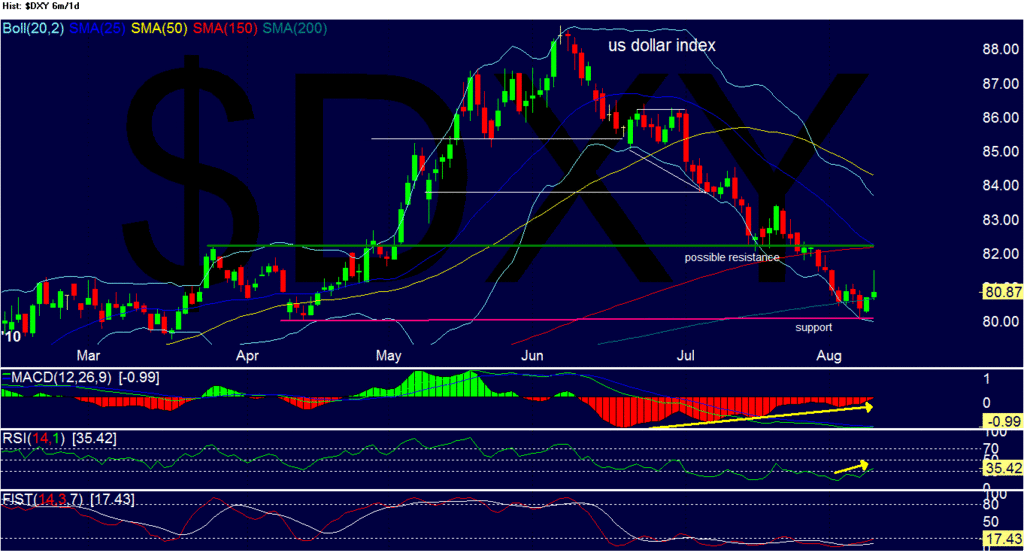
A couple of charts, beginning with US dollar Index.
US charts are still indicating a pullback is imminent.
US dollar index has finally bounced, at 80.08, a double bottom with April, when equities peaked, and that last candle confirms it. Candles are flirting with the 200 day sma. Up goes the dollar, down go equities.
Daily chart shown, weekly had just entered oversold.
Note the bullish positive divergence.
Dow Jones Industrial Average... Fell to trendline and reverted to that cluster around the 10,6XX. But should be broken to the downside soon. Negative divergence, and the absence of upper shadows on candles with resistance at 10700.
Incidently.... I see negative divergence in my posts v number of favourites. Last month I was away for two weeks and didn't post. As soon as I returned and posted, lost 2 favourites straight away, and now another two. It's telling me something, and I am listening. So, fewer posts from me from here on.

- Forums
- ASX - By Stock
- XJO
- wednesday's wisdom
wednesday's wisdom, page-5
-
-
- There are more pages in this discussion • 147 more messages in this thread...
You’re viewing a single post only. To view the entire thread just sign in or Join Now (FREE)
Featured News
Add XJO (ASX) to my watchlist
 (20min delay) (20min delay)
|
|||||
|
Last
8,095.2 |
Change
-64.800(0.79%) |
Mkt cap ! n/a | |||
| Open | High | Low |
| 8,160.0 | 8,160.0 | 8,063.2 |
Featured News
| XJO (ASX) Chart |


