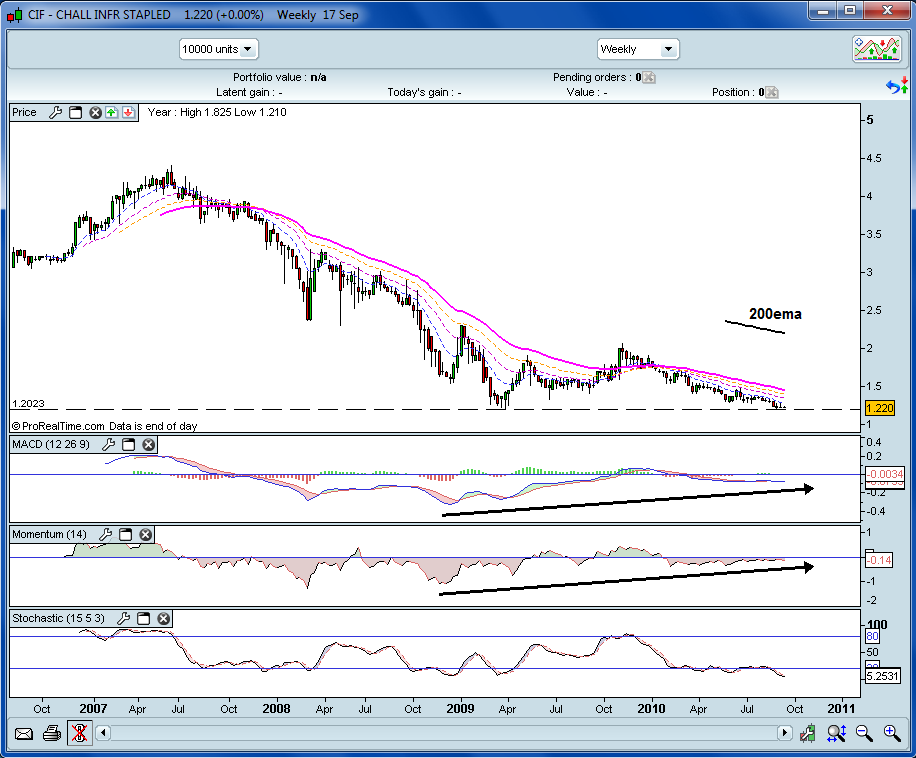
CIF - weekly, this is all the data I have.
It's been in a steady downtrend for three years and it's just made a double bottom (could be bullish) at its all-time low.
The weekly MACD and momentum indicators show bullish divergence (higher lows on indicators v. equal lows on price).
Weekly slow stochastic shows stock oversold for most of this year.
A long way from the 200ema and at some stage there will be 'reversion to the mean'.
Current price represents a low risk entry but if it makes a new all time low then rethink.
- Forums
- Charts
- weekend charting 17 - 19 september
weekend charting 17 - 19 september, page-112
-
- There are more pages in this discussion • 79 more messages in this thread...
You’re viewing a single post only. To view the entire thread just sign in or Join Now (FREE)
Featured News
Featured News
FWD
Queensland's housing crisis an opportunity for ASX builder Fleetwood – and taxpayer cash a safe harbour from the storm
TLX
Telix jumps 11.6% as US government indicates proposed medicare changes won't affect prostate cancer drug


