CTX
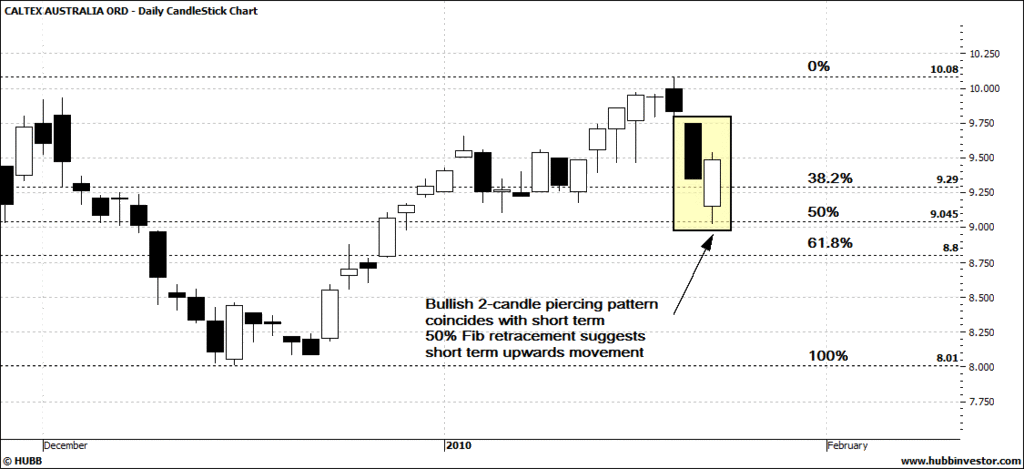
Short term chart shows 50% Fib retracement coinciding with a bullish 2-candle pattern know as the piercing pattern.
It's always more preferable to have more than one signal of course, so with the candle pattern and Fib retrace together it makes me bullish about CTX short term.

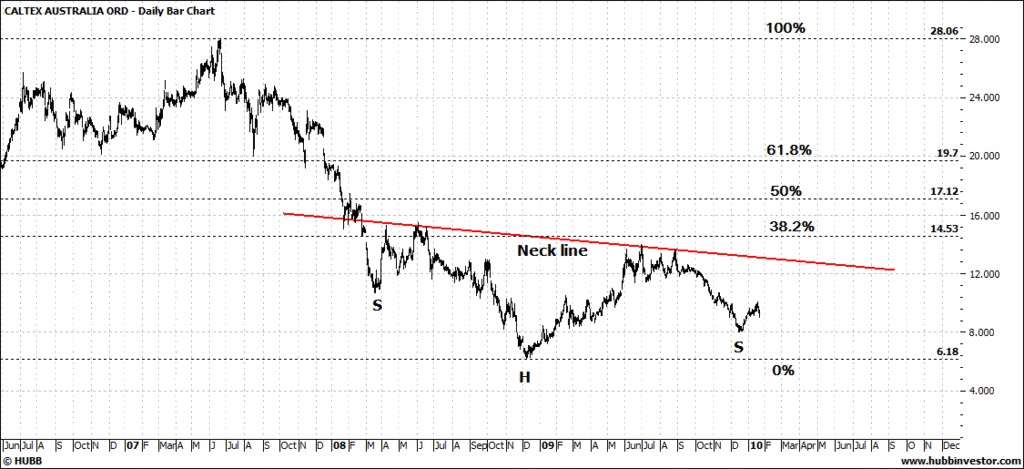
The long term chart shows an inverted head & shoulder pattern in development.
It won't be confirmed until the SP gets closer to neck line, but it is difficult to imagine anything else happening.
We've already seen resistance at the 38.2% area so it would be logical to expect next real resistance at the 61.8% area once neck line is broken.

- Forums
- ASX - General
- weekend charting 22/01/10
weekend charting 22/01/10, page-18
-
- There are more pages in this discussion • 145 more messages in this thread...
You’re viewing a single post only. To view the entire thread just sign in or Join Now (FREE)


