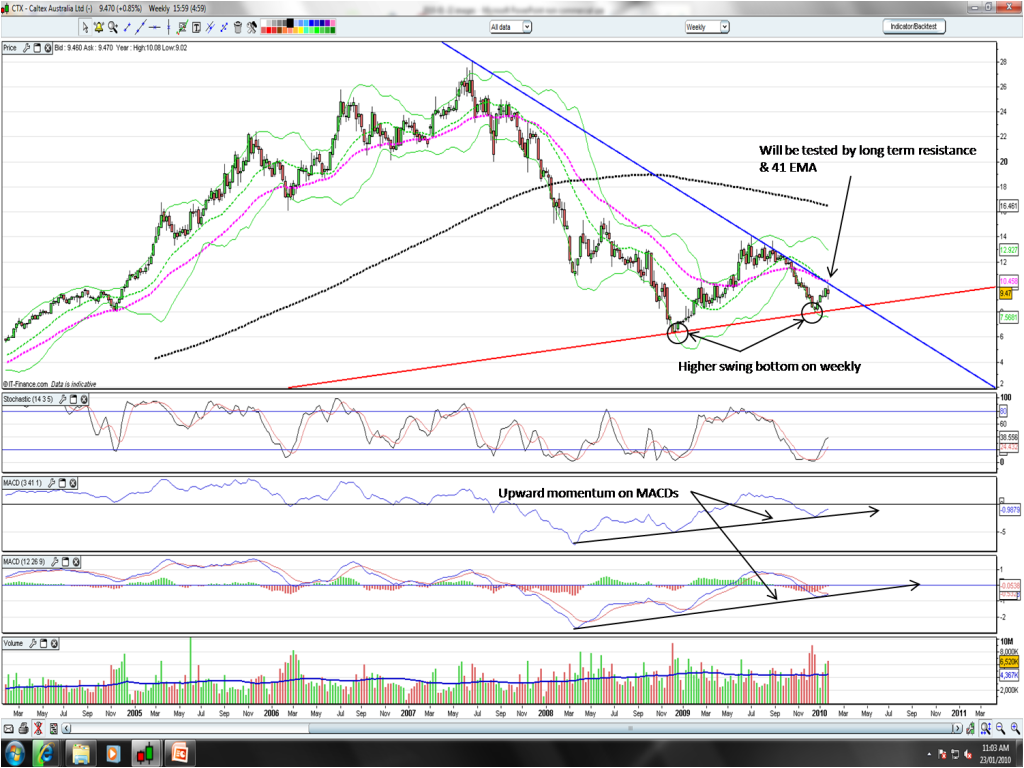
Thanks for the chart on CTX Totters. I've used longer timeframes than the 5 min but interestingly I get roughly the same short term trading range as you've indicated with the red pitchfork. Zooming out the upper tyne of this fork coincides reasonably well with a longer term downtrend line seen on the weekly where the momentum is currently upwards, but approaching that resistance line:
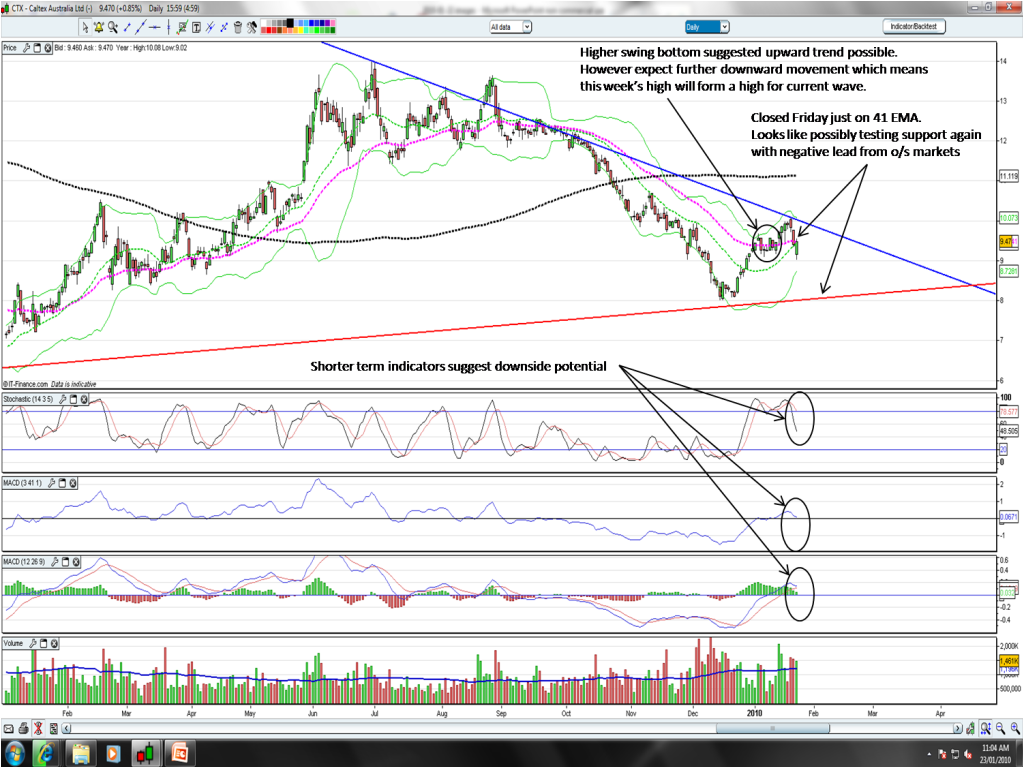
On the daily, its already bounced off that line and the momentum on this timescale is now down:
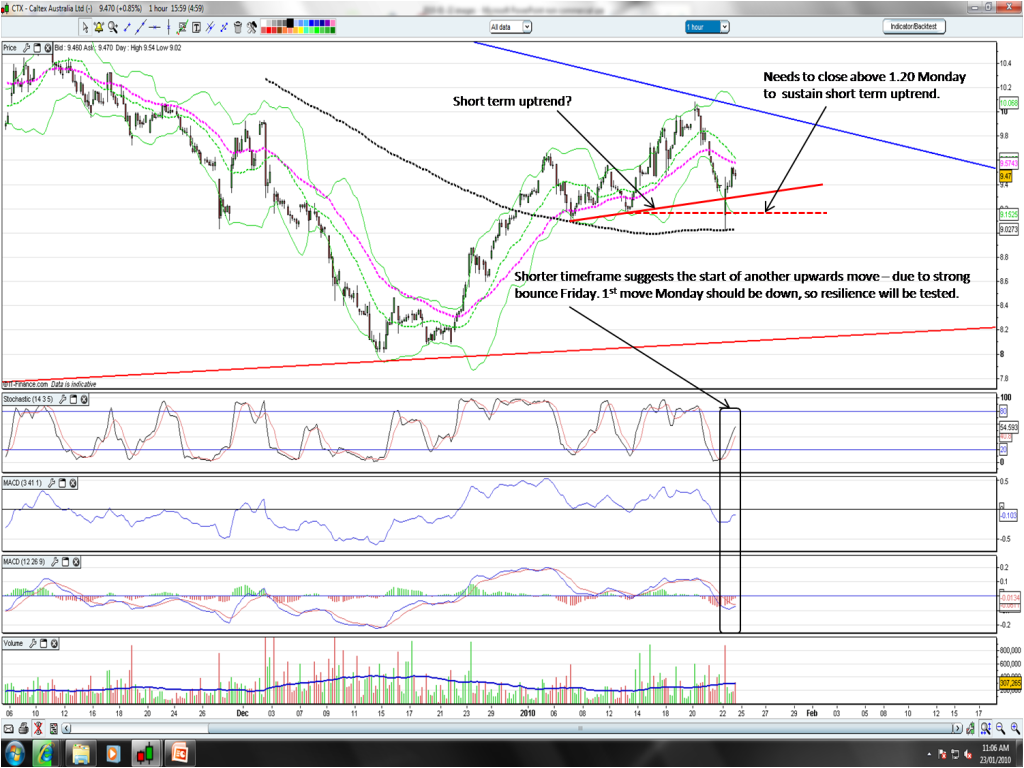
Whereas on the hourly I start to see the same thing you're seeing:
On that timeframe there's a short term uptrend line based on two slightly lower lows earlier this month. If it manages to close above that dotted red line Monday there's a chance it will reach the resistance line again, which is where I agree a short would be worth a go. Otherwise, I think we'll see it go below $9 again before turning and returning to the longer term uptrend (which coincides with fundamentals valuation which suggests CTX is very cheap at these prices).
Cheers, Sharks.
- Forums
- ASX - General
- weekend charting 22/01/10
weekend charting 22/01/10, page-25
-
- There are more pages in this discussion • 138 more messages in this thread...
You’re viewing a single post only. To view the entire thread just sign in or Join Now (FREE)
Featured News
FWD
Queensland's housing crisis an opportunity for ASX builder Fleetwood – and taxpayer cash a safe harbour from the storm
SKS
SKS Technologies wins US$90M award to supply power to international hyperscale data centre in Melbourne


