Morning all,
Well, what a fantastic day. Australia has it's first Tour de France winner in Cadel Evans. I'm off for a celebratory ride this morning, but, before I do, I have a FMG chart for you Confucius.
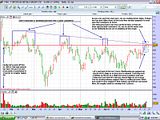
As I have said on the chart, there are two possibilities for the supply that we have encountered over the last few days. It could be the pros selling their stock that they purchased at the lows toward the end of June, or, locked in traders in the three boxes I have marked.
What I would be waiting for, is a confirmed breakout of the $6.63 resistance followed by a test from above. What I mean by that is for it to come down to $6.63 from above, test it on low volume closing back on it's high. Not only will it be testing the resistance, but it will test the breakout volume as well.
Now, we don't enter on the "potential" test bar, because it still needs to be confirmed. What we wait for is an up bar that has a slight increase in spread and volume to the test bar. It has to close nice and high on the bar. This confirms the test. The slight increase in spread and volume proves to us that there is a lack of selling....
I hope this helps. BTW, the Charts forum is super strong these days. Keep up the good work guys and girls. You know who you all are....
Cheers,
Ads
- Forums
- Charts
- weekend charting 23rd and 24th july
weekend charting 23rd and 24th july, page-45
Featured News
Featured News
The Watchlist
VMM
VIRIDIS MINING AND MINERALS LIMITED
Rafael Moreno, CEO
Rafael Moreno
CEO
SPONSORED BY The Market Online


