Hello Everyone!!
First i just want to remind everyone in Perth we will be having our traders get together on the 29th of August. There is more details on the general thread so please reply there or swing me an email and ill get you on the list :)
Well it was a very volatile week as expected as the bulls and bears battled it out for control. The bulls had some stiff over head resistance on the charts and the bears had some extremely over sold indicators to fight so it was a good time to be day trading with some ripper days in the middle :)
I am still a bear at heart but i must disclose i hold hardly anything overnight during these volatile times and have been sleeping like a baby :) None the less i am happy to show you a few charts i see and why i am happy to step aside as i have been taught and trade what i see each day which i find much better personally and am comfortable with that :)
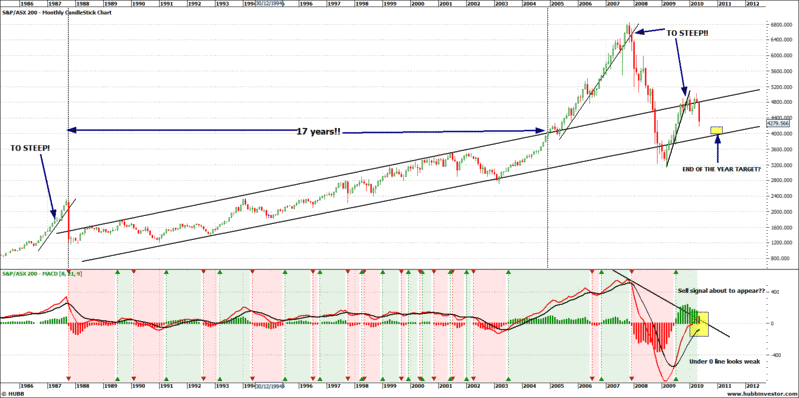
Ok the first chart i have is one that has a long term channel, i saw something similar on the XJO thread for the DOW and replicated that as i was really intrigued by this. (sorry i can't remember who posted it but they deserve the credit i am just wanting to share it)
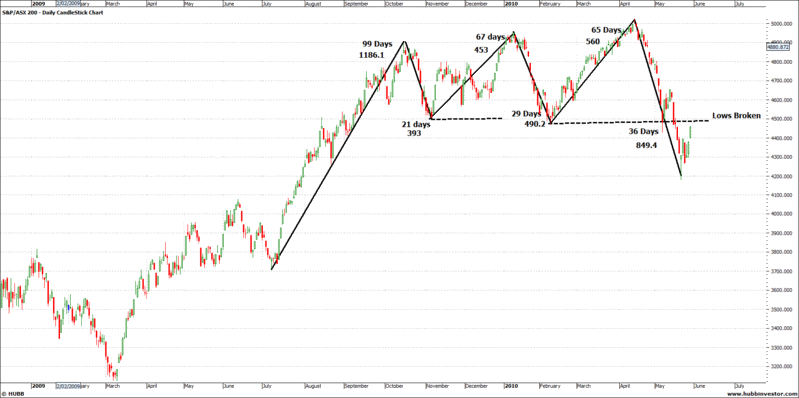
The next chart i have included is just something i recently read as to giving a few clues to what the market is telling you. It is basically showing the moves the market had been making showing that the up moves were decreasing while the down moves were increasing. Something had to give and it did. Now credit goes to rob and im sure he will explain more about it in a video or something he will do about once you have gone over 30 days in one direction normally you will go 60 days in that direction so might be some more down coming with the 60th day from the high falling on the 14th of June. I actually was thinking we might turn down from here but i mean again im happy for it to go up as i prefer green anyday this is just my 2 cents...
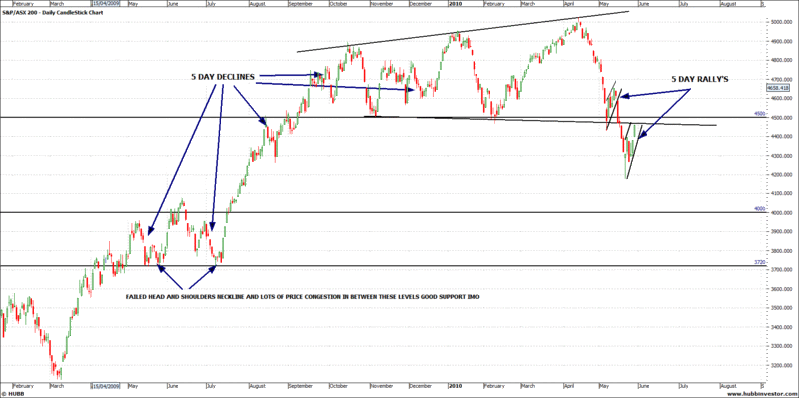
This last chart is just another thing i was playing with noticing that in the big up moves what the price was doing and the 5 day down moves (GENERALLY as some were more than this) but as a rule im now thinking that because we are in a downtrend that the roles have switched and we might be making 5 day rallies and then more down. I think we have maybe seen the worst of the big slips down although if you repeat those ranges once more... well another time lets just see how it plays out.
Last note on that chart i drew that megaphone not from the lows as maybe should have but it did make it fit a bit better to what i was thinking and we certainly have a bit more resistance ahead needing to break that 4500 and get a move on up again just my thoughts.
I will maybe stay a bit quiet this weekend and watch the others work the magic really looking forward to everyones thoughts again coming into this week :)
Have a great weekend everyone :)
- Forums
- ASX - General
- weekend charting 28th-30th
Hello Everyone!!First i just want to remind everyone in Perth we...
-
- There are more pages in this discussion • 31 more messages in this thread...
You’re viewing a single post only. To view the entire thread just sign in or Join Now (FREE)
Featured News
Featured News
The Watchlist
VMM
VIRIDIS MINING AND MINERALS LIMITED
Rafael Moreno, CEO
Rafael Moreno
CEO
SPONSORED BY The Market Online


