Thumbnail attempt...
XJO chart that i keep running showing the swings in the market.
That last drop took 15 days and moved 440 pts the one before was 850 pts in 36 days so showed that move down happening much stronger. However this recent rally has come 50pts shy of exceeding the previous rally in less time so could maybe indicate strength coming back in the market. Should our next leg down be less than the 15 days or less points down i would suspect market is gaining strength and it could move higher... just something i follow to test the waters...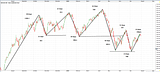
weekend charting 30 july 2 october, page-27
-
- There are more pages in this discussion • 119 more messages in this thread...


You’re viewing a single post only. To view the entire thread just sign in or Join Now (FREE)