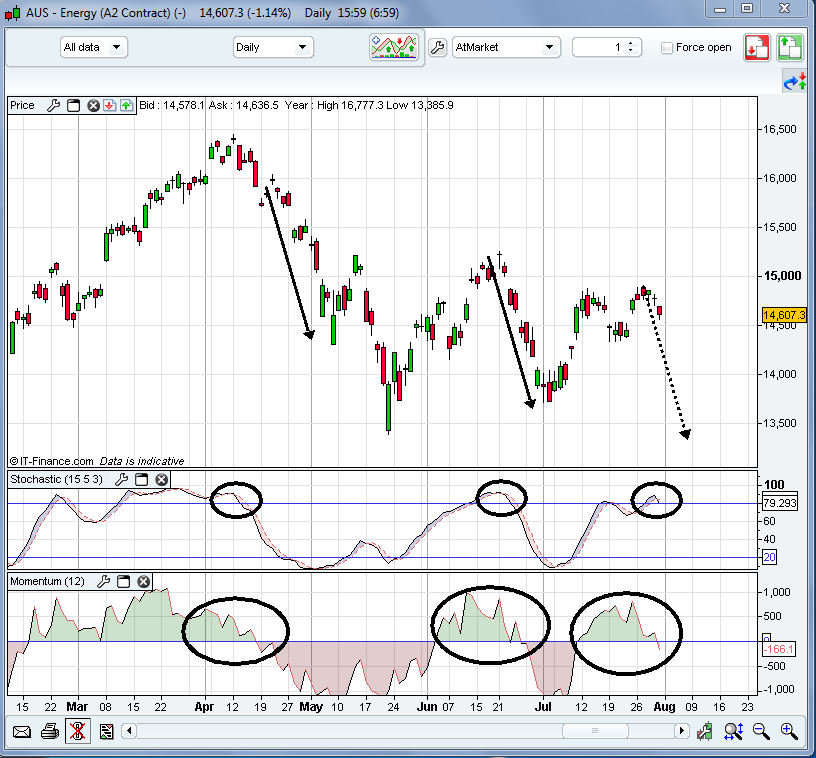
An interesting chart of the Energy sector XEJ.
When momentum has crossed down then the resulting falls are shown with the arrow. Momentum has crossed down now again and stochastic is also hinting at the same.
Just not sure how much this sector affects the market as a whole.
- Forums
- Charts
- weekend charting 30 july 2 october
weekend charting 30 july 2 october, page-41
-
- There are more pages in this discussion • 105 more messages in this thread...
You’re viewing a single post only. To view the entire thread just sign in or Join Now (FREE)


