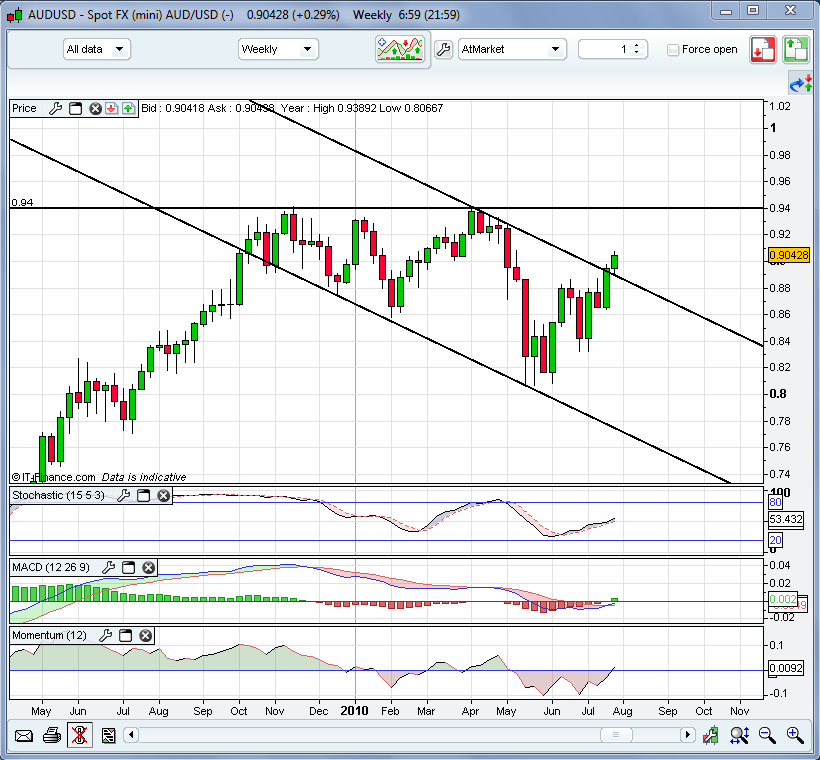
Here's a weekly chart for the Aussie Dollar v. USD.
Everything is pointing up at this stage and looking strong. Momentum has just turned positive, MACD lines have just crossed and stochastic is nowhere near overbought yet.
Being a weekly chart, it will not take into account daily fluctuations which can be considerable so I wouldn't use this chart myself as a guide to trading not should anyone else!
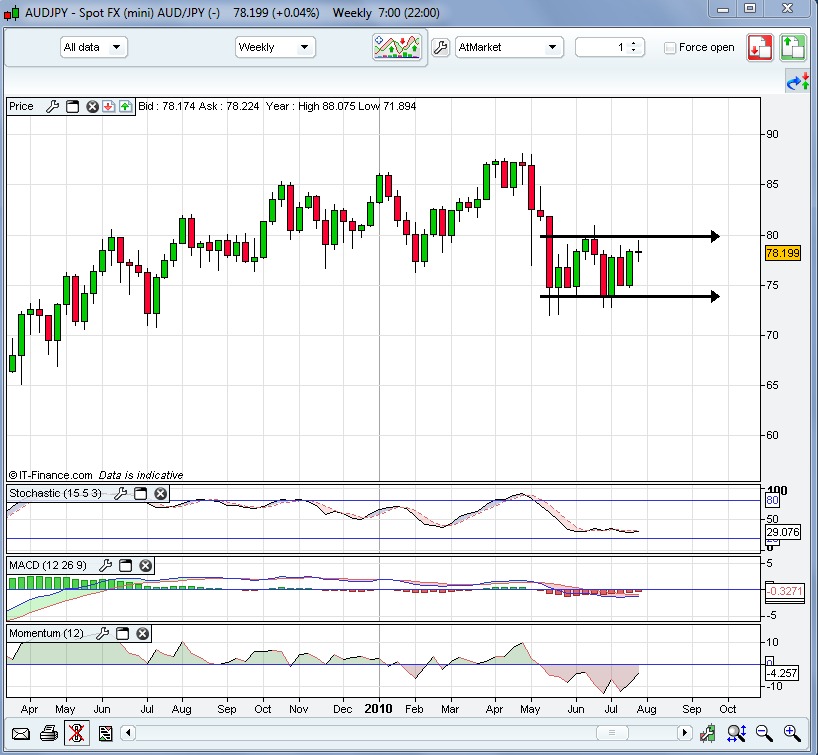
I also looked at other weekly AUD charts. AUD/CAD looked very similar but charts with EUR, GBP and JPY do not look as strong or advanced. In fact those charts show sideways action as the weekly AUD/JPY chart below shows. This may mean that the USD is particularly weak at the moment rather than great AUD strength.
- Forums
- Charts
- weekend charting 30 july 2 october
weekend charting 30 july 2 october, page-82
Featured News
Featured News
The Watchlist
BTH
BIGTINCAN HOLDINGS LIMITED
David Keane, Co-Founder & CEO
David Keane
Co-Founder & CEO
Previous Video
Next Video
SPONSORED BY The Market Online


