Hey here is my longer term MQG Chart showing some repeating ranges.
I did a time series one also but i havent put it on the internet yet was wondering if rob or someone fantastic as that could maybe do it so i can compare??
Anyway the daily looks over bought but it might not fall to far. Fairly low risk entry with stops under the 195 EMA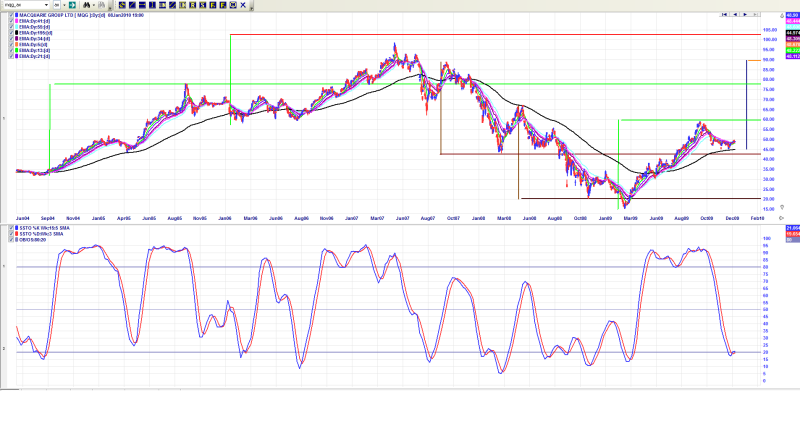
weekend charting 8th jan 2010, page-46
-
- There are more pages in this discussion • 105 more messages in this thread...


You’re viewing a single post only. To view the entire thread just sign in or Join Now (FREE)