Hi Goroos
Interesting question and NAB is a good example.
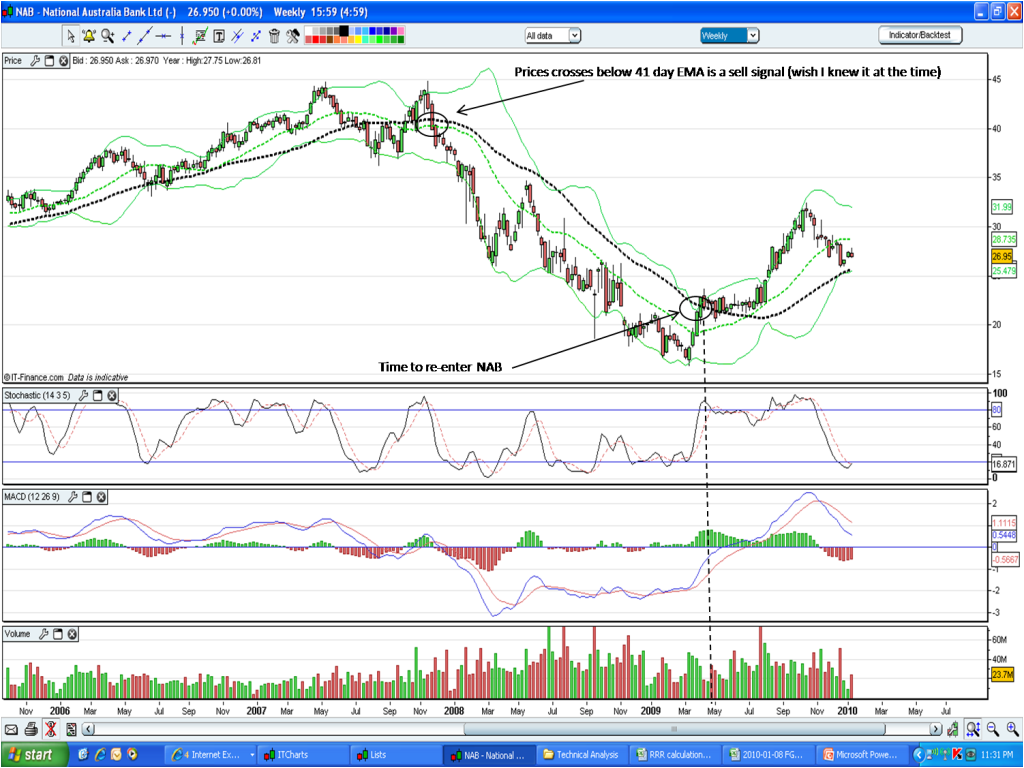
If you look at the weekly chart for NAB and use the EMA on price as a buy/sell signal, then life is pretty simple, cos you are looking at long term trends that may have a cycle of 6-24 months.
Note the following weekly chart. Very simple, using a 41 day EMA as a longer term buy & sell signal which is very effective. NAB becomes a buy when price closes and remains above the 41 day EMA, and its a sell when it closes and remains below the 41 day EMA (Robbbbbbb's methodology which we all know).
If you traded on this you would've save a lot of money by exiting NAB in November 08 at about $40, and bought back in in April 09 at about $22, and you'd still be in it (and going on the weekly chart that's still a good trade since price looks to have bounced above the 41 day EMA curve).
Note that if it were to cross on the current ST downtrend, and you sell, then looking at the trade, you've bought at $22 and sold at about $25 (about where the EMA is now), a profit of $3 compared to the difference between the October high and the March low of $32 - $16 = $16 profit (if you timed it perfectly.
Now presumably over the longer term it'll go back up, but in the 7 months from March to October you only make $3 on $22 invested - just better than bank interest.
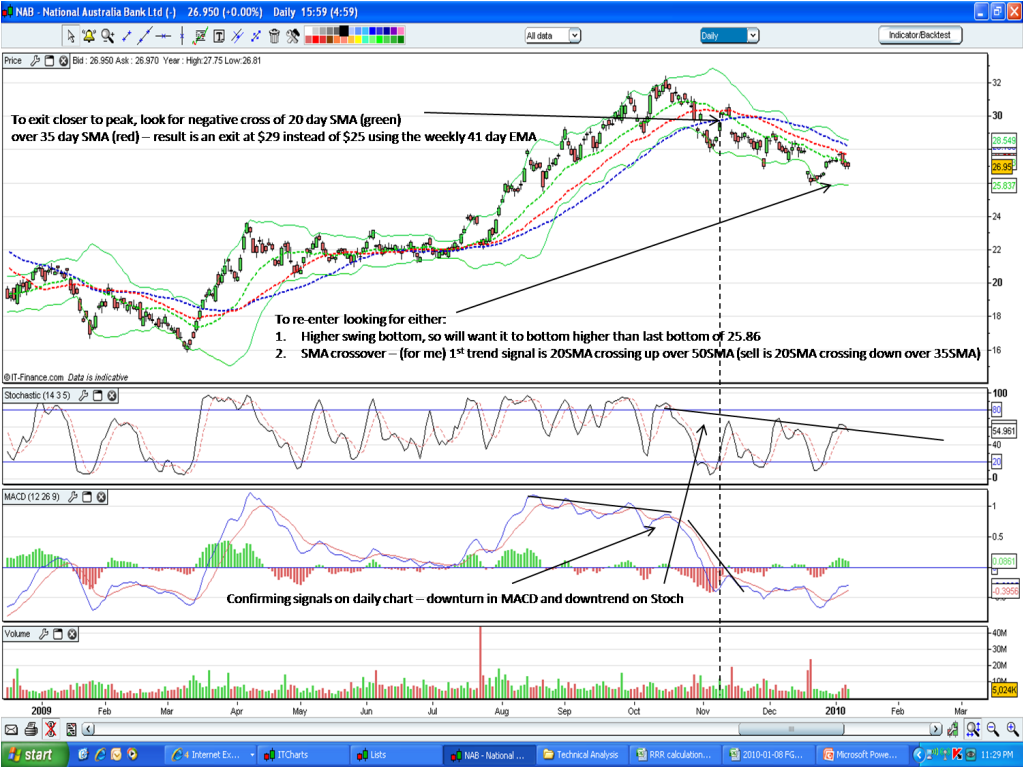
But what if you decided that when it topped 2 months ago in October that it was going to retrace for a short term period? This is where price starts moving against the EMA curve for the 1st time in this example, so what to do? Leave it and wait to see if in fact it bounces above the EMA curve and continues the long term trend or crosses below, which triggers a bearish signal that it is entering a long term downtrend? You can leave it to see what happens and let the weekly signal tell you whether to stay in or get out at the point, but of course from the time it peaks short term its gonna cost you to find out, because from the peak back to the weekly EMA curve is worth a few bucks a share in this case.
So from my perspective once there is recognition of a short term peak and therefore a possible convergence between price and the EMA on the weekly curve, rather than wait for it to come all the way back and either bounce before or wait for it to cross down, use a shorter term signal to exit nearer the peak and retain those profits, and then wait for either a confirmation that the price will return to the long term uptrend by bouncing or existing completely before the start of a LT downtrend.
On the shorter timeframe of the daily chart, I use the Stoch and MACD much more heavily in conjunction with price signals to provide such a shorter term signal. Using NAB as an example again (see following daily chart), using MAv signals of your choice plus confirming MACD and/or Stoch signals will provide you with an earlier recognition of the ST downtrend, and you can exit earlier, then re-enter when it confirms a turn on that timeframe or not as the case may be:
I'm sure there are plenty of other views, but for me the jist of it is if you go long term, I think you only need to use weekly's, but if you are trading shorter term, you at least want to know what the underlying trend is because "the trend is your friend" so even if you enter and exit multiple times within a trend cycle, you use the shorter timeframe signals for that and the longer term one to determine which way the trend is.
PS: FWIW had I known this stuff back in 2008 I would've saved a lot of dough on NAB that I've had to earn back since.
Cheers, Sharks.
- Forums
- ASX - General
- weekend charting 8th jan 2010
weekend charting 8th jan 2010, page-5
Featured News
Featured News
The Watchlist
NUZ
NEURIZON THERAPEUTICS LIMITED
Dr Michael Thurn, CEO & MD
Dr Michael Thurn
CEO & MD
SPONSORED BY The Market Online


