FMG
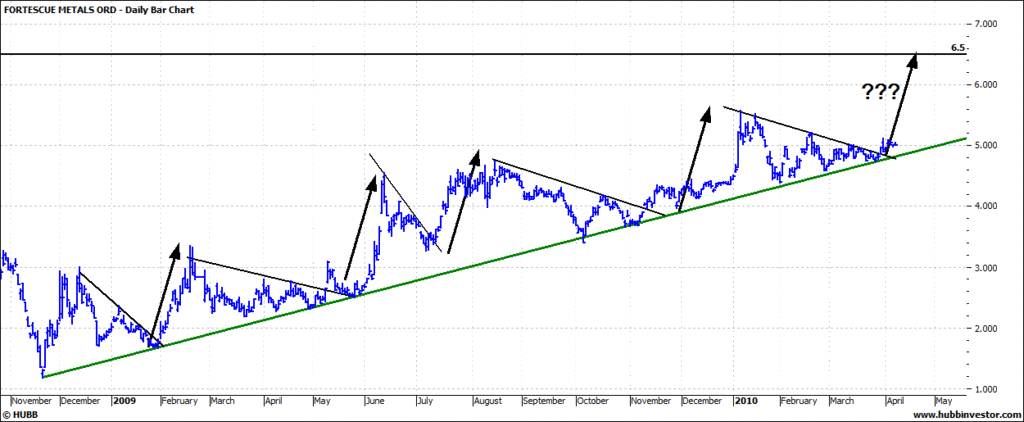
First chart daily over about 15 months shows a rock solid uptrend line and minor wedges that have resulted in approx $1.50 moves.
There was also some support and resistance at the 6.50 level late '07/early '08.
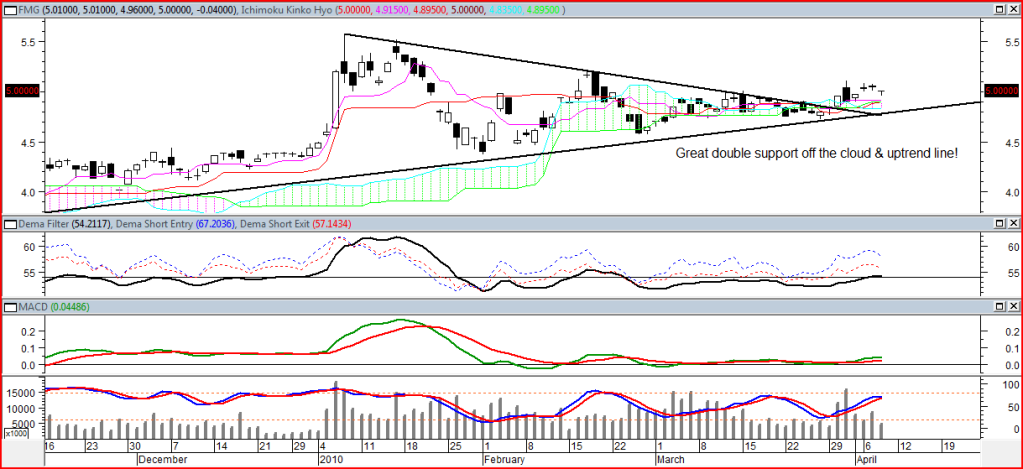
Second chart is close up with extras showing a multiple support area.
The thing to note here is that even though the popular slow stochastic is approaching overbought, the other two indicators show how it could keep going.
Could happen again, doesn't mean it will.
Trade what you see.
Cheers,
10cents
- Forums
- ASX - General
- weekend charting 9 april
weekend charting 9 april, page-65
-
- There are more pages in this discussion • 150 more messages in this thread...
You’re viewing a single post only. To view the entire thread just sign in or Join Now (FREE)


