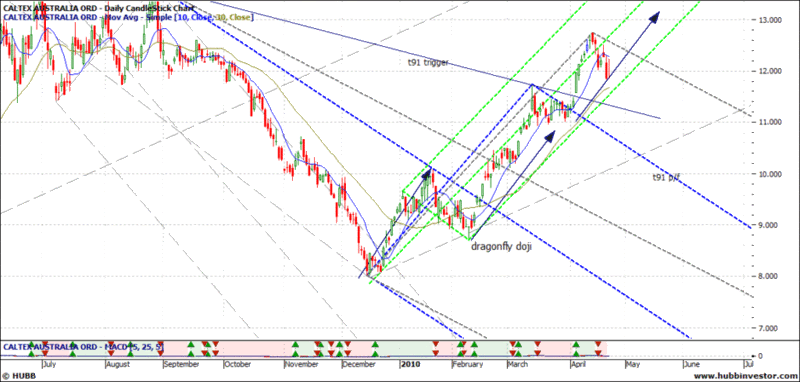
Hi T91; very elegant ctx chart & took me a few seconds to work out what I was looking at as the base of the forks not shown eg the blue line connecting low of 14/12/09 to high of 12/3/10. (I dont know why some software leaves that line out but can be confusing imo)
I have charted ctx over the last few months and in fact it is a model of where I think my investing should go to. IMO after several months of s/p falling from $14 - $8 for several fundamental reasons (can I mention that word on this thread? LOL) it was looking like a screaming buy to me in late 09.
Watched it do quick rally to $10 & then fall back to 9 where it formed a perfect dragonfly doji on 9/2/10. (O: 8.96 H: 8.97 C8.96 L 8.72) which signalled beginning of run up to recent h $12.75 .. thats a lazy 44% gain in 4 months for what I consider a very low risk!! (ps I did not know about dragonfly dojis until reading on hc & they are proving to be very reliable indicator as a change in trend imo)
My chart below and I have added in your blue p/f; it also shows a few ealier p/fs & a couple of speed angles for good measure.
A question for the p/f Master t91 if you have the time?/!
Why do you consider that the blue d/t p/f is a true fork? eg why is it any more true than say the grey one I have added? (Is it the price gapping the trigger line which is always nice to see?)..Arent they (p/fs) sort of valid until proven otherwise? & proven by test/retest and/or price hitting med line within pivot zone?
Ps2 have to confess did not enter trade & have not made 1cent off ctx (lol)
Cheers GJ .

- Forums
- ASX - General
- weekend charting anzac long weekend
Hi T91; very elegant ctx chart & took me a few seconds to work...
-
- There are more pages in this discussion • 19 more messages in this thread...
You’re viewing a single post only. To view the entire thread just sign in or Join Now (FREE)
Featured News
Featured News
The Watchlist
LU7
LITHIUM UNIVERSE LIMITED
Alex Hanly, CEO
Alex Hanly
CEO
SPONSORED BY The Market Online


