Should bunch these charts together like totter, but think I'm finished each time.
Just playing with oscillators and somebody wanted ncm. This chart shows a clear pattern between the momentum(13day) crossover and the sp movement over the last year. Perhaps it will follow in kind as it is crossing over downwards in my example. I should have drawn in an upwards support line, which it could well bounce off and continue up, but just wanted to highlight this.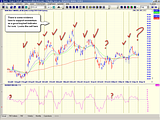
weekend charting anzac long weekend, page-45
-
- There are more pages in this discussion • 95 more messages in this thread...


You’re viewing a single post only. To view the entire thread just sign in or Join Now (FREE)