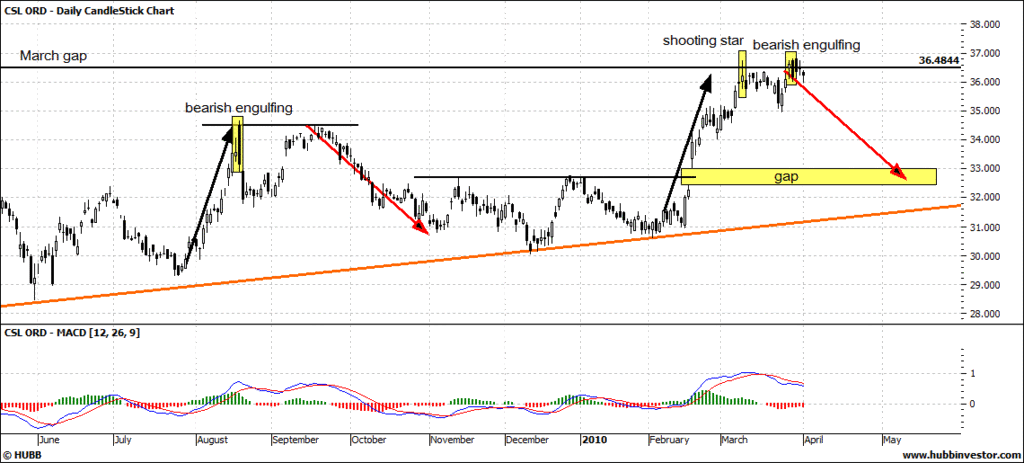
My chart from CSL thread.
"And this is why I'm bearish short term.
Two prominent bearish candle patterns formed at a known resistance level - the gap during March '09.
This came after a strong month long rally that saw it gain 20%.
A large gap formed near the start of that rally that I believe will need to be filled. That gap also coincides with two previous swing highs and will most likely form a key support area in the future.
There was an almost identical move in August with a large bearish engulfing pattern and a short term double top like now. An identical down move would see the gap filled.
I'm also a believer in long term uptrend lines acting as magnets, drawing share prices back to reality, keeping rises slow and steady.
Cheers,
10cents
- Forums
- ASX - General
- weekend charting easter
weekend charting easter, page-133
Featured News
Featured News
The Watchlist
RAC
RACE ONCOLOGY LTD
Dr Pete Smith, Executive Chairman
Dr Pete Smith
Executive Chairman
SPONSORED BY The Market Online


