G'day gj0201, 10c
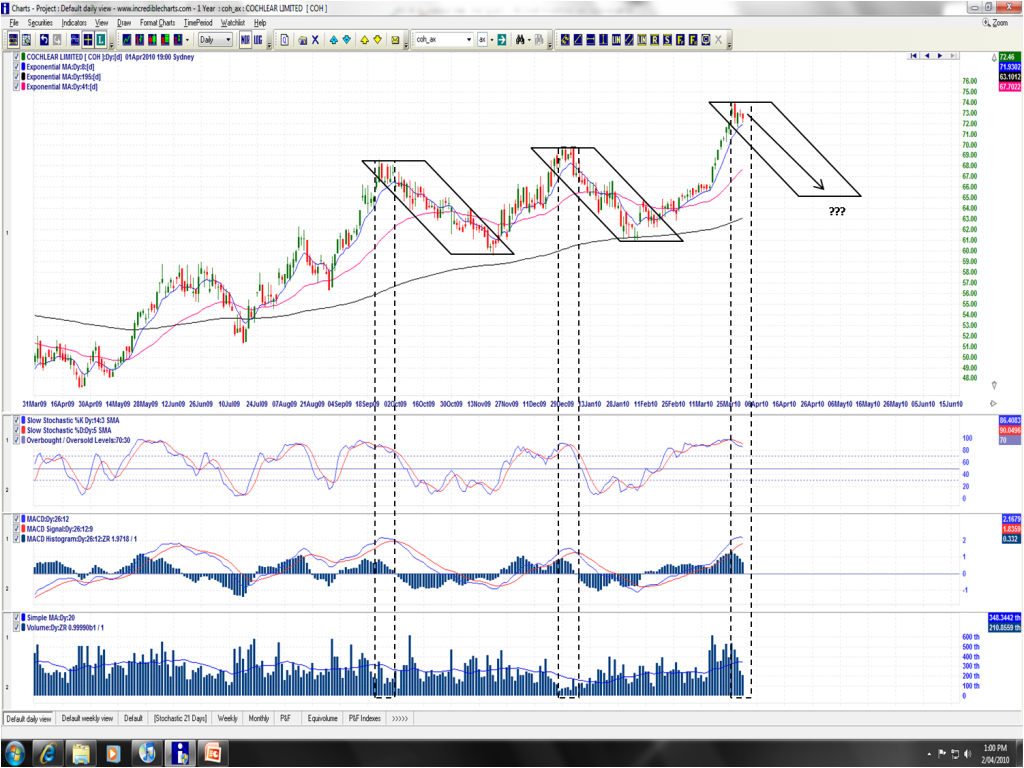
I agree that setup on COH looks pretty attractive for a short. I've put up anther copy of the daily chart showing what you've shown. Looks like about a $9 range from $74 to $65 if the entire speed angle plays out (is it a speed angle if its down? Robx7 maybe we need a new term for a downward speed angle???) In addition to a similar setup on price, the daily volumes are declining as they did at the previous two peaks:
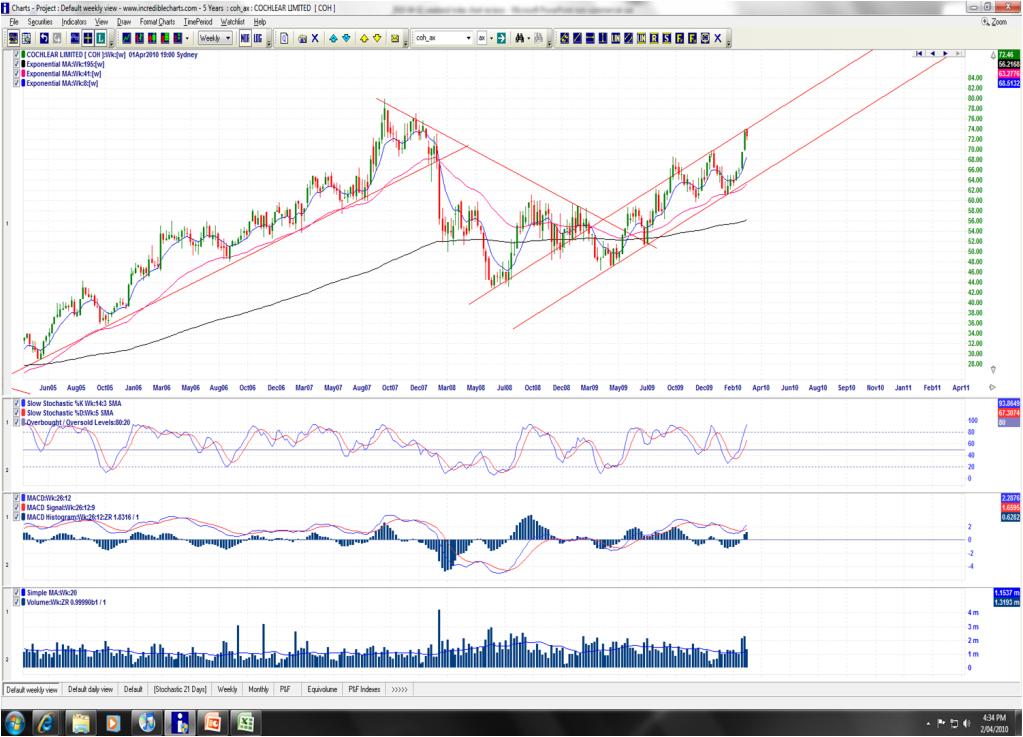
However, I would urge caution. If you look at the larger timeframe view (weekly), you will see that in support of the short setup it looks like its peaked on this wave as well. But the cautionary indicators:
1. The Stochastic doesnt look fully mature just yet, which suggests it might be possible we'll see price poke its head up out of that bullish channel like it did at the October high.
2. Any pullback would be a counter-trend move since COH is in a fairly strong bullish trend pattern atm.
I dont follow COH, but I find it interesting that while its in the health sector it doesnt appear to be acting as a defensive stock - its wave look like they occur in time with the general market's waves,whereas I would have though it might be counter-cyclical.
Anyway, there you it is what it is.
Cheers all, Sharks.
- Forums
- ASX - General
- weekend charting easter
weekend charting easter, page-31
-
- There are more pages in this discussion • 221 more messages in this thread...
You’re viewing a single post only. To view the entire thread just sign in or Join Now (FREE)


