Hey well i have been trying out a few charts and thought i would give my spin on WPL, This might be a bit long but i am trying to express what is going on my head (maybe to much but im trying to learn gann and just apply some things i have learnt recently and to try think outside the box with my charts to try and learn a bit more as i go. Comments and criticism would be appreciated :)
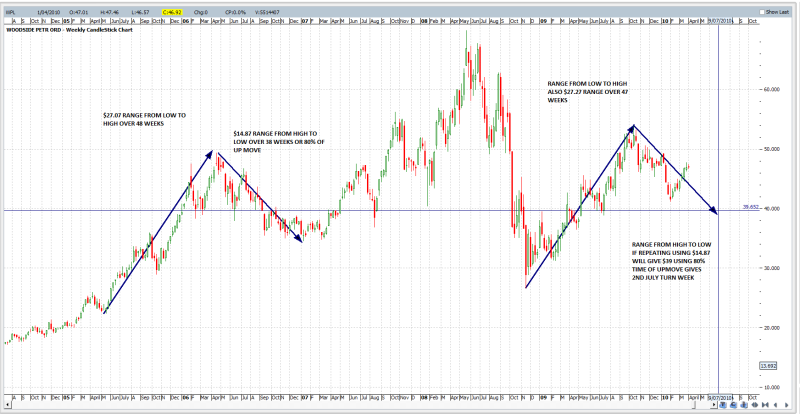
Ok i will start with the weekly, as gann always says start on the larger time frames and work inwards. At first glance i thought it looked bullish as i looked at a few indicators then i thought scrap those and lets just analyse the time and the price (back to basics). I noted that there was a repeating range from a past low to top. The range ran up $27.07 over a 48 week period. I was looking for a 50% retracement in time and price but this i couldnt get but i did however find that the retracement in time was 80% of the move which i gather is weaker than a 50% retracement but the price retraced close to 50% at 54% of the move at $14.87. I then repeated this range from the lows in November and projected it forward.
This range was also a $27.28c range over a period of 47 weeks. (close enough i thought?) I then applied a 80% of the up range to the down move which heads to the 2nd of July or 37 weeks after the highs for the final low using the $14.87 range which give a low of $39.
I think it could still be bearsh as it looks to me that it is still in a down move making lower lows and lower highs on the weekly chart that is if it doesnt head back up strong from here. To me it looks like a level of strong support/resistance over time and might prove hard for it to break upwards? but if it does i would happily swap shorts for longs :)
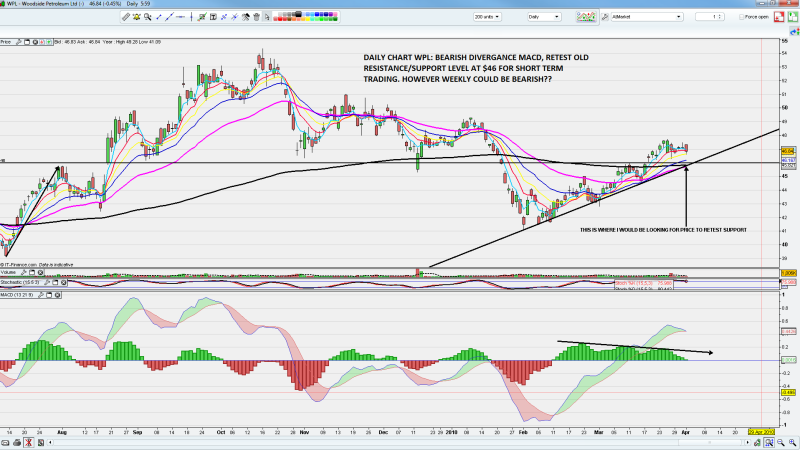
The daily to me for a shorter time frame looks like it coudl retrace, bearish divergance on the MACD and the fact that it has done 3 shorter impulse moves higher could be a sign that it is ready to turn down as gann states that normally a share will have 3 or 4 waves in a trend. Never go short on the second higher bottom and never go long on the second lower top of a move.
This move however looks to be either gearing up for a fourth or to turn down, We could see some support of price where i have indicated on the chart at $46 which is where the 41ema, 195ema, uptrend line and support level all coincide.
I hope this wasnt to much to read, and i would love feed back from anyone who knows gann stuff, i was just looking for patterns but i would love any help or way to improve. I will try do some more analysis of the chart i was thinking that on the weekly i know from that first move up there is a way to predict where the next high could be using the moves in time? i need to go back over the book and check it out, if i find anything i will post it up for testing or if you guys could show me much appreciated.
- Forums
- ASX - General
- weekend charting easter
weekend charting easter, page-38
Featured News
Featured News
The Watchlist
NUZ
NEURIZON THERAPEUTICS LIMITED
Dr Michael Thurn, CEO & MD
Dr Michael Thurn
CEO & MD
SPONSORED BY The Market Online


