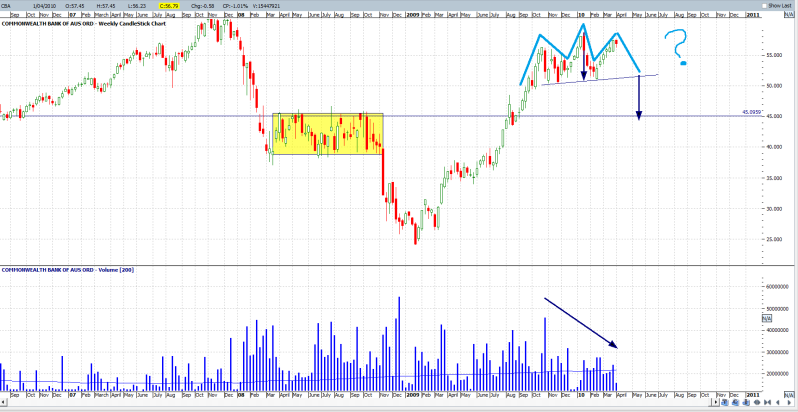
Well This is just something i noticed on CBA, bit more for a giggle than anything else. It is more likely that it might just be absorbing time from the big move upwards like it did in the highlighed box on the way down, maybe same but for another leg up?? wishful thinking?)
i dont think this would play out but you never know, i noticed it could be making a head and shoulders pattern on the weekly (forgive me rob) and maybe it could complete the pattern.
I was having a browse over the definition again just to make sure the volume could be confirming this and seeing as the market has been fluffing up on next to nothing maybe my suspicions could play? just something to think about for longer holders maybe? ill put the definition up for a volume confirmation of a head and shoulders pattern as:
Volume Confirmation
High volume on the first peak,
Moderate volume on the middle peak,
Low volume on the third peak, and
A sharp increase in volume on the break below the neckline.
So maybe?
If it did break and play the distance from the head move down it would take it to just above the level of old price congestion. could be something to watch... man i sound bearish maybe i need to put a bullish chart up... like the SDL weekly ;)
- Forums
- ASX - General
- weekend charting easter
weekend charting easter, page-41
-
- There are more pages in this discussion • 211 more messages in this thread...
You’re viewing a single post only. To view the entire thread just sign in or Join Now (FREE)


