Hey Guys,
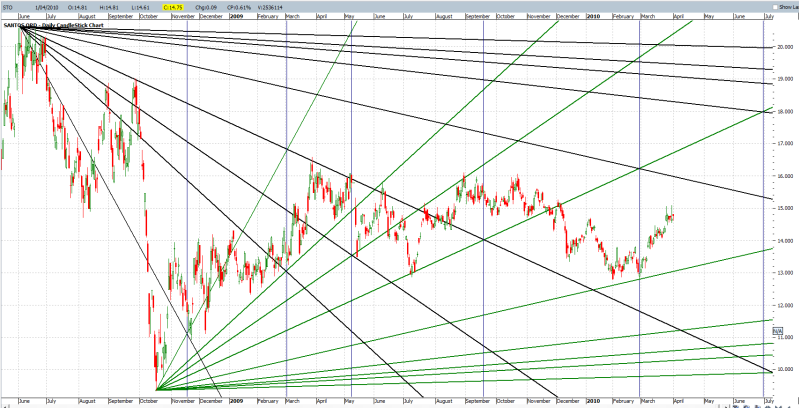
Well i kinda half stole this chart well the concept anyway from an article but i found it interesting and since i trying to learn gann found it interesting and applied it to the chart to try explain what i saw was happening.
Ok so it has a lot of lines on them, basically what those are are gann fans, They are basically to do with time and price and they move down from a 1:1 move which basically will mean for every price movement it does and equal movement in time to a 2:1, 3:1, 4:1 etc and in reverse 1:2, 1:3, 1:4 like that. Basically they show points of resistance on the chart for time and price.
Where the fanns from the highs and the fans from the lows intersect are points in time that are important to watch for possible turns. As you can see the recent one on the lows worked perfectly as did some of the previous ones. For drawing this i have mearly moved through the fans because as price moves out of one fan it respects the next levels, i have just high-lighed points as noted by the fans as levels of interest. The next one looks to be in June but you could maybe look at the April one also? ill certainly watch to see if anything happens and maybe as i get more time i will back test them to see how they work better on other shares and points in time.
Hope this enlightens a few people :)
- Forums
- ASX - General
- weekend charting easter
weekend charting easter, page-56
Featured News
Featured News
The Watchlist
RAC
RACE ONCOLOGY LTD
Dr Pete Smith, Executive Chairman
Dr Pete Smith
Executive Chairman
Previous Video
Next Video
SPONSORED BY The Market Online


