Hi Ange, I dont know about others, but I always use the slow stochastic, so in IC charts I choose the slow stochastic indicator. The fast stochastic as far as I'm concerned is just too choppy and provides too many false signals. In IC you'll notice that the stochastic has 2 parameters, whereas in the slow stochastic it has 3.
If you take what is supposed to be the "conventional" stochastic settings using a %K calculated over a 14 day period and a %D being the 3-day moving average of the %K, the conventional stochastic is a 14,3 stochastic. The slow stochastic is simply the fast stochastic with a %K which is a 3-day moving average of the fast stochastic's %K - and hence it is not as choppy as the fast stochastic's %K line. The slow stochastic %D is then the 3-day moving average of the slow stochastic %K, or in other words a 3-day moving average of the 3-day moving average of the fast stochastic %K.
So the 2 parameter notation for the conventional stochastic setting above (14,3), is re-written as (14,X,3), where X represents the "speed" or senstivity of the stochastic. If X = 1, then it is the conventional fast stochastic, if X = 3, it is the conventional slow stochastic.
I dont know why whoever invented the conventional stochastic chose 14 days. I choose 15 days because it represents 3 full trading weeks.
In IG they only list a stochastic indicator, which can be either fast or slow depending on the settings chosen, via the 2nd parameter, as per the 3 parameter notation described above.
For daily and longer charts I choose 15,5,3 as described yesterday, which means the stochastic is extra slow (I want to minimise false signals and am happy to sacrifice reaction time to achieve that, since I figure getting on later means momentum is on my side). In IG for my intra-day and FX work, I choose 15,5,5 because I find it useful to further remove volatility-driven false signals when dealing on an intra-day basis.
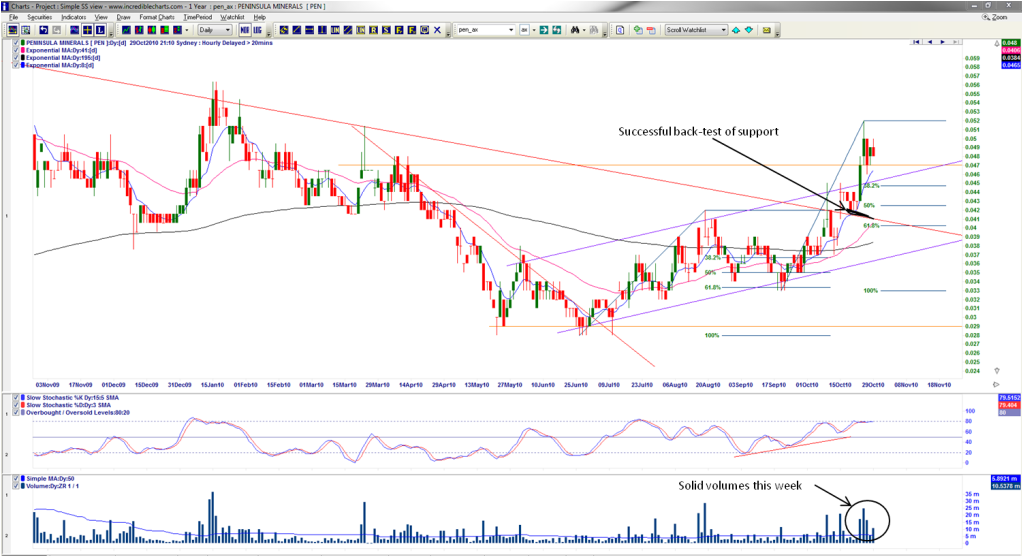
Cheapcharlie, I had a look at PEN here last weekend, and at that stage price had closed just above that downtrend resistance (see updated chart below). The key at that time in my view was whether price would confirm that downtrend line as support, and this week's move on buying strength does appear to have confirmed that. Its currently respecting static support at 0.047 based on the March/April closing highs. It looks as if there's still momentum here, but volume will be the key to ascertaining whether that translates into further advancement to the next resistance level aound 0.055, or whether it consolidates. If the latter, watch for failure of the 0.047 support cos it could well fall back to the 61.8% fib, which coincides with that downtrend line.
Cheers, Sharks.
- Forums
- Charts
- weekend charting end of october!
Hi Ange, I dont know about others, but I always use the slow...
Featured News
Featured News
The Watchlist
CCO
THE CALMER CO INTERNATIONAL LIMITED
Matthew Kowal / Andy Burger, CCO / Head of E-Commerce
Matthew Kowal / Andy Burger
CCO / Head of E-Commerce
SPONSORED BY The Market Online


