Morning All, have a few requests that didnt get charted to post this morning
Lucky, i just saw your NAB request and will be looking at that myself this morning so will post later
Paul, sorry about the volume on video but i had some sleepy heads here
Part 1 Weekend Charting Thread
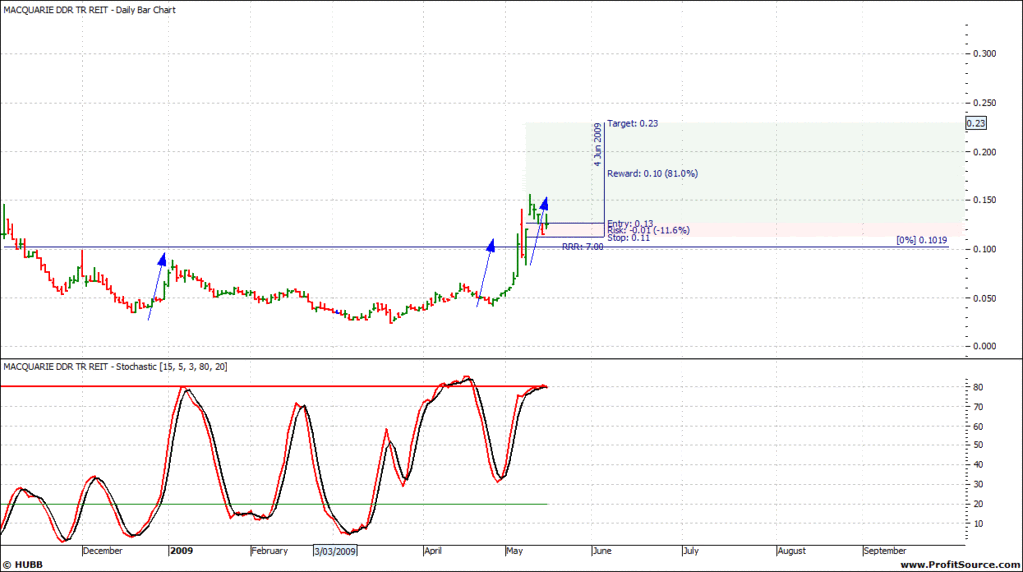
MDT
Looking at entry from here would pose a 11% risk, and given where markets are at i would suggest only a swing trade.
Holding position would probably see stops around the 12 or depending on your strategy as longer term say 8 cents to absorb any weakness that might happen
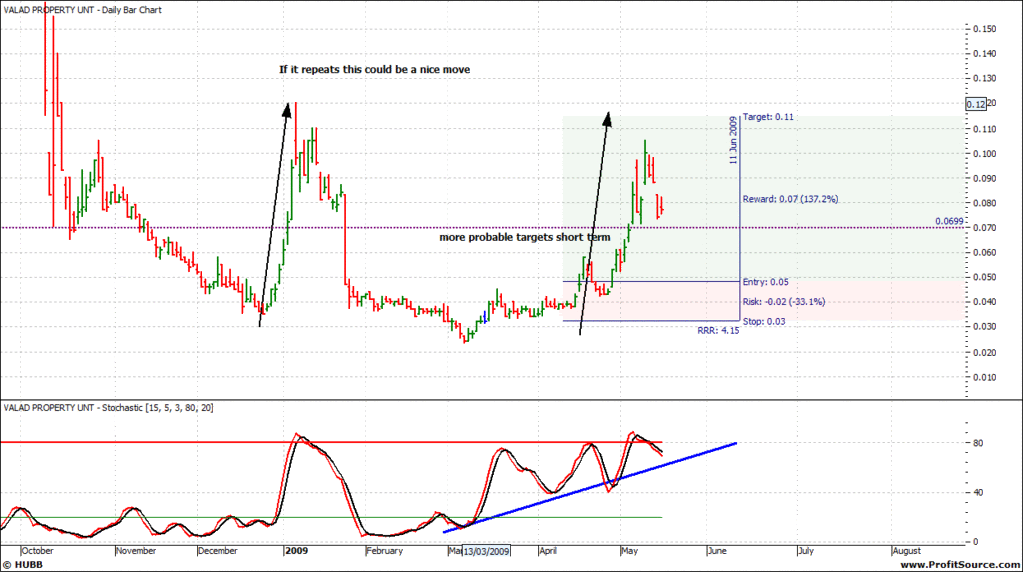
VPG
The speed nearly repeated and has come off a bit from the recent high of 10.5. Stops for those in a position would be around the7 cents level. And could be good for a run to target IF momentum turns north again
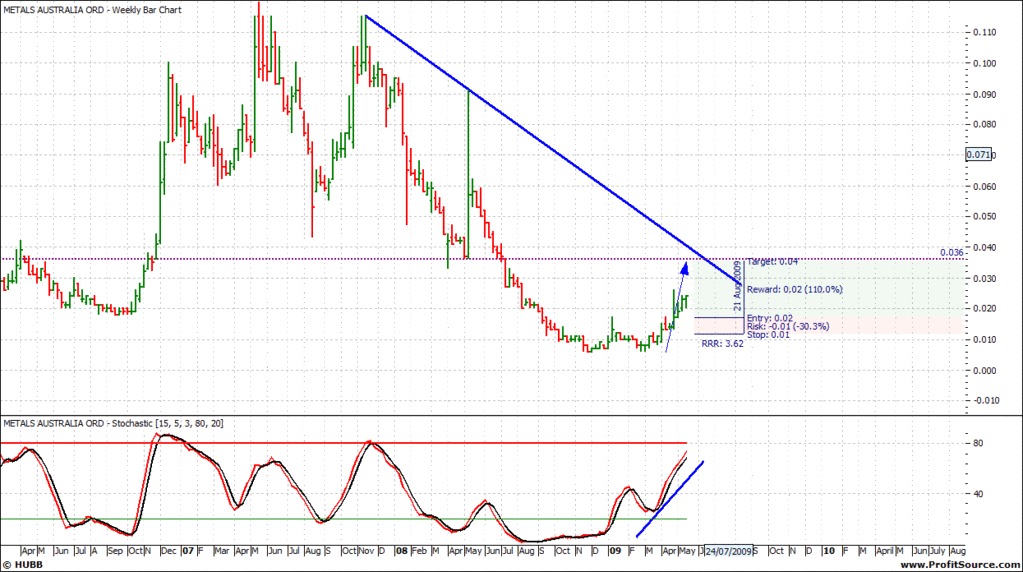
MLS
The weekly chart still suggest no reason to sell longer term but mindful its a small stock so 1 cent can be alot of percents
I still think you could see the speed angle play out at some stage
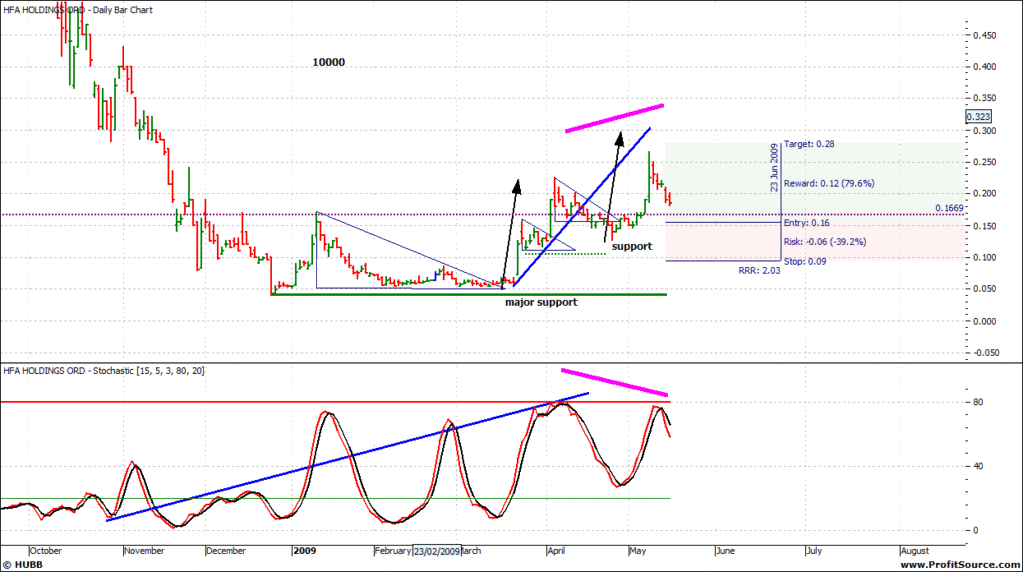
HFA
Pretty clinical chart in the way it has continued to followed the road map we plotted.
Stops, if you werent stopped out at 21 then maybe have them under the 15 cent level. The pinky's on the chart might suggesting you need to absorb time now before any further move north.
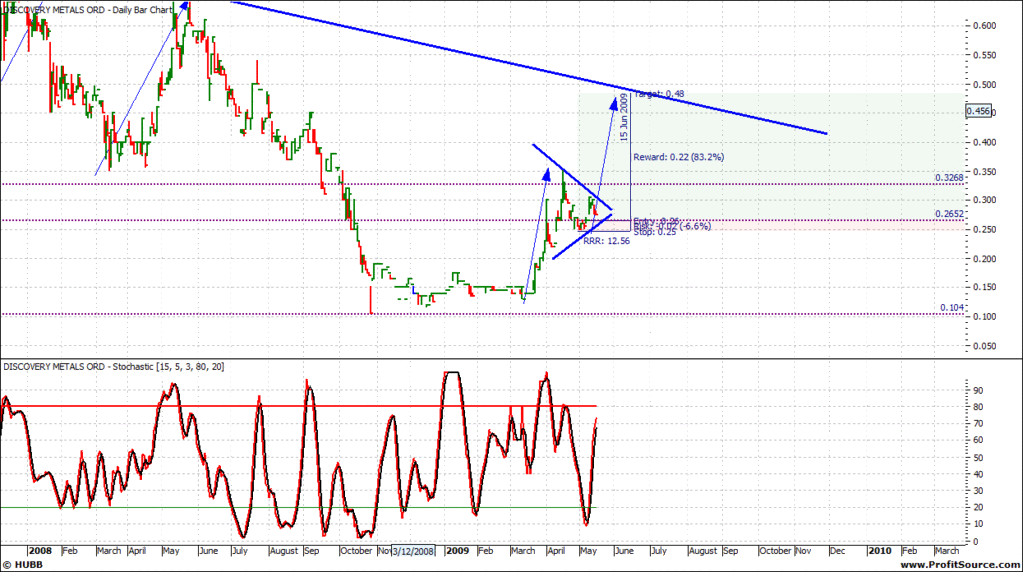
DML
Direction is uncertain but watch for a break out of the squeeze at present. I would favour the upside and stops under the break lower ??
- Forums
- ASX - General
- weekend charting part 2
