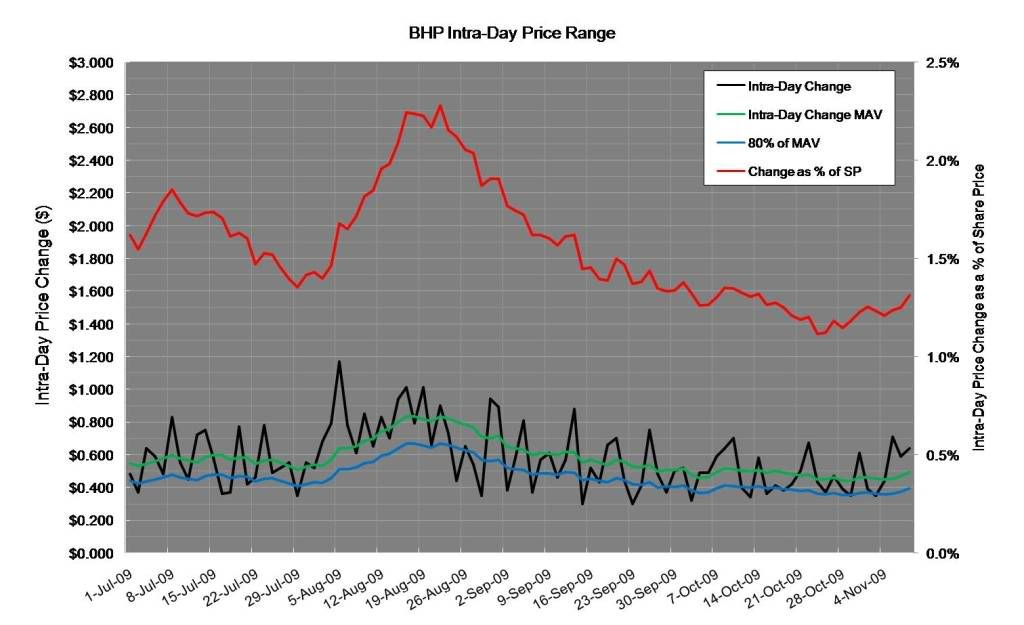
G'day Robbbbbbb, your intra-day price swing posts reminded me of some excel charts I used to do of intra-day price swings at a time when I was experimenting with day trades. Following is an example chart featuring BHP's intra-day price swings for the 3-4 months:
The chart shows the actual intra-day price swing (high minus low), the % of the share price that swing represents, and a 10 day SMAV of the intra-day price swing (and 80% of the SMAV). What I found useful from the chart is that it shows quite clearly how large the intra-day price swing is, how consistent it is, and whether its trending smaller or larger.
Thus if you wanted to trade BHP intra-day on a safe basis you just need look at the chart and say in October the absolute minimum price swing on any day in October was $0.30, while the average was actually closer to $0.50.
Then using standard intra-day charting tools on say 1, 5 or 10 min timeframes you can pick the bottom or top and set a trade for the minimum price swing being experienced or for a trade with a slight risk of not hitting target use the SMAV or 80% thereof to set the target.
I had a reasonable success with it but I have a day job so the problem I had was having the time to work it.
Cheers, Sharks
- Forums
- ASX - General
- weekend charting
G'day Robbbbbbb, your intra-day price swing posts reminded me of...
Featured News
Featured News
The Watchlist
ACW
ACTINOGEN MEDICAL LIMITED
Will Souter, CFO
Will Souter
CFO
Previous Video
Next Video
SPONSORED BY The Market Online


