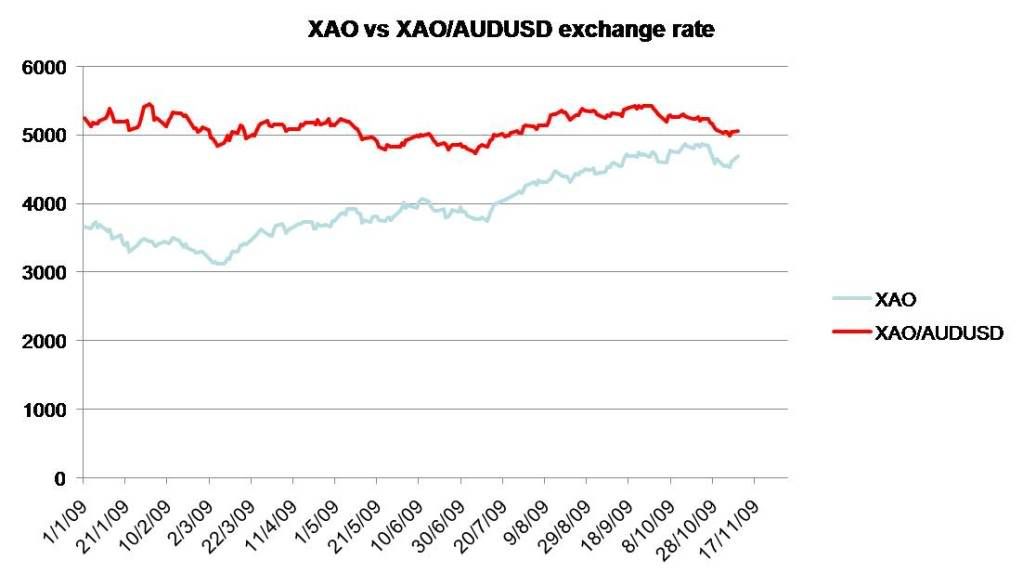
Thanks k8sy, that did the trick. I put that data in a chart with the XAO daily closing price, and charted that versus the XAO/AUDUSD exchange rate of the same day, and obtained the following comparison:
I think its quite neat when you look at the XAO in that perspective, it trades very flat all year, whereas the XAO itself bottomed in march and then has been increasing ever since.
I'm not sure exactly what to make of that but I'd say what it means when you value the all ords in USD terms its been fairly stable all year.
Tomorrow I might try the same thing but going back a few years to see what happens. I hope this is the kind of thing you're looking for - if you want a copy of the spreadsheet I'll put a link to a googledoc version tomorrow night after I've put the extra data in it.
Cheers, Sharks.
- Forums
- ASX - General
- weekend charting
Thanks k8sy, that did the trick. I put that data in a chart with...
-
- There are more pages in this discussion • 21 more messages in this thread...
You’re viewing a single post only. To view the entire thread just sign in or Join Now (FREE)
Featured News
Featured News
The Watchlist
LU7
LITHIUM UNIVERSE LIMITED
Alex Hanly, CEO
Alex Hanly
CEO
SPONSORED BY The Market Online


