de317,
Looks like I'm the only one not in Brisbane so I'll try and be helpful.
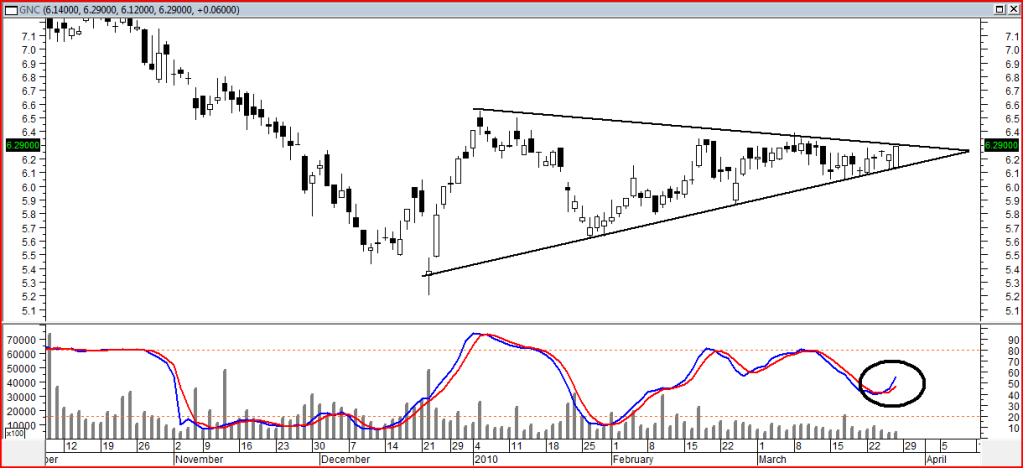
GNC - First chart daily close-up showing the current wedge and stochastics turned up suggesting break up.
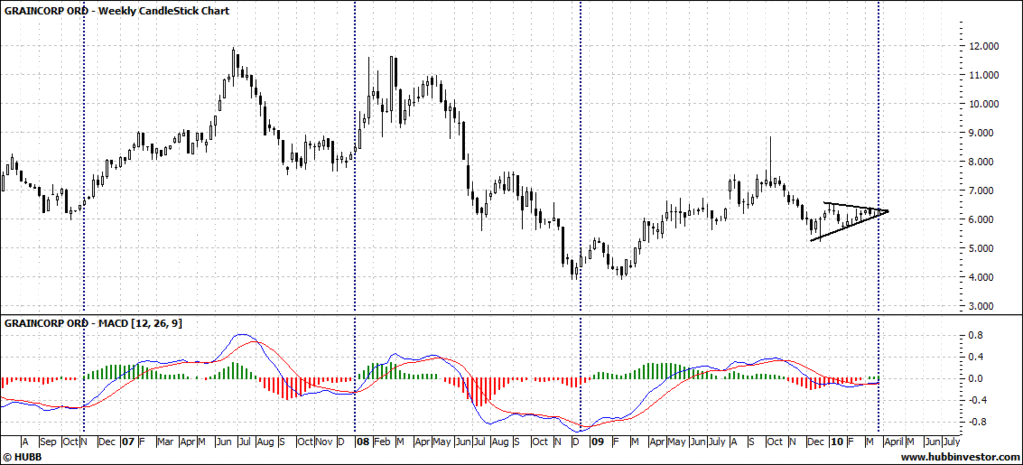
The second chart is a weekly highlighting when the blue MACD line turns up.
If it all looks good then mid 7s is realistic.
If it all goes wrong then support could come in the form of a double bottom at the mid-low 5s.
Cheers,
10cents
- Forums
- ASX - General
- weekend charting
weekend charting, page-30
-
- There are more pages in this discussion • 102 more messages in this thread...
You’re viewing a single post only. To view the entire thread just sign in or Join Now (FREE)
Featured News
Featured News
The Watchlist
LGP
LITTLE GREEN PHARMA LTD
Paul Long, CEO
Paul Long
CEO
Previous Video
Next Video
SPONSORED BY The Market Online


