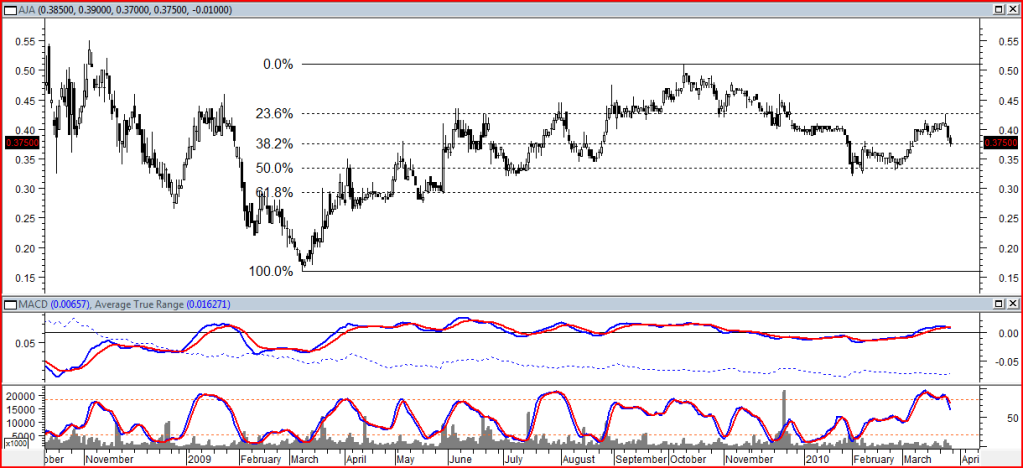
AJA - part of the sector that has recovered the least since GFC. With that in mind, I don't think the highs of 2007 are relevant any more.
The chart concentrates on the period from the March '09 lows. Fibonnaci lines have worked very well here as targets and support and resistance.
(I wonder if pitchforks will show similar points).
The most recent high on 24/3 was a shooting star which is one of my favourite bearish signals because it rarely fails, especially when it bounces off a known resistance area, in this case the 23.6% line. It would have made a great short.
MACD has turned down and just crossed as have the stochastics already making the 50% line a target again.
It would have to break 23.6% to start looking positive for the longer term.
Cheers,
10cents
- Forums
- ASX - General
- weekend charting
weekend charting, page-52
Featured News
Featured News
The Watchlist
ACW
ACTINOGEN MEDICAL LIMITED
Will Souter, CFO
Will Souter
CFO
Previous Video
Next Video
SPONSORED BY The Market Online


