AXM
Very defined sideways channel here at the moment which has offered trades of +80% since sept low.
Risk is defined and reistance is defined, so take advantage of the trend channel and if the triangle pops then i would think about adding.
It will need momentum to take out the reistance line and thats when yo could get the real surge.
Even though its sideways actions, and probaly suggests traders, i would be willing to suggest this is being accumulated ???
Oh, but then i looked at the weekly and boy i kinda think this could be a beauty, keeping risk and entry in check ???
I think its clear if the pattern continues and the fundamentals are ok, that what could/should happen here ???
The weekly kinda backs up my argument it being accumulated.
FMS
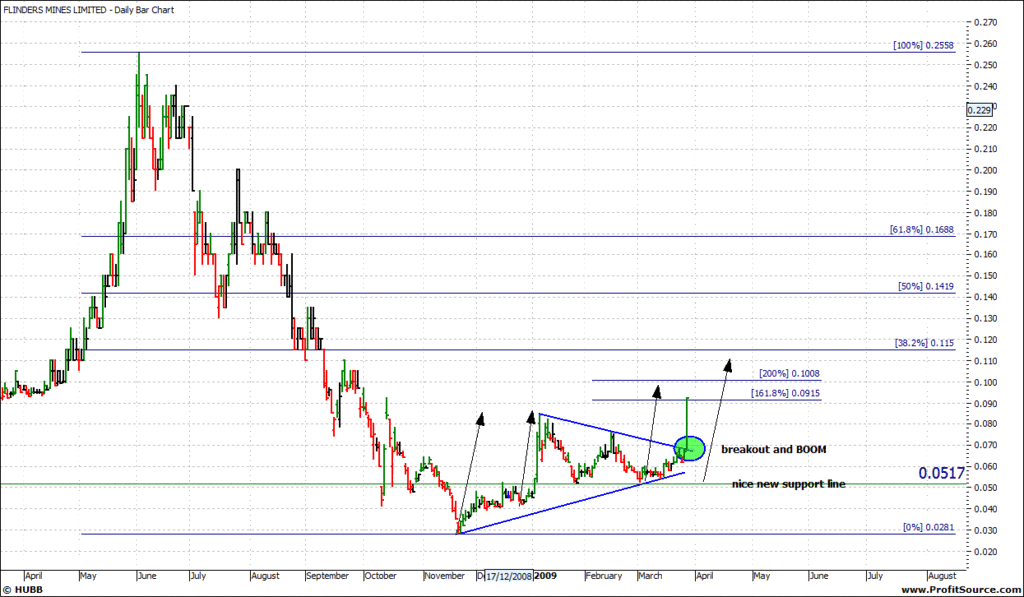
I see this broke out friday and boom straight to the fib level and a repeating range. could and probably will keep going but rely on a smaller time frame to gain entries and set stops.
BLY
great work by pete and AB, so i may as well throw a couple of thoughts out there too :)))
I think wednesday i said be good to buy if broke 12 and it did so was a nice one, where to from here???
Clearly an uptrend on the daily, so again rely on the swing trades for now, still not over bought and could get up to 19
Weekly, i really dragged the chart out to find that repeating range and again, it points ot the 38.2% fib levels, amazing how the little downtrend it wants to break of now, is parrallel to the top 2, i guess downside if it breaks the lows this time, the dotted line points to 0, however i cant see that happening ??
- Forums
- ASX - General
- weekend charting
weekend charting, page-46
Featured News
Featured News
The Watchlist
CCO
THE CALMER CO INTERNATIONAL LIMITED
Matthew Kowal / Andy Burger, CCO / Head of E-Commerce
Matthew Kowal / Andy Burger
CCO / Head of E-Commerce
SPONSORED BY The Market Online


