Ange, no problem, hope it works :)
Here is my WES chart.
Daily-
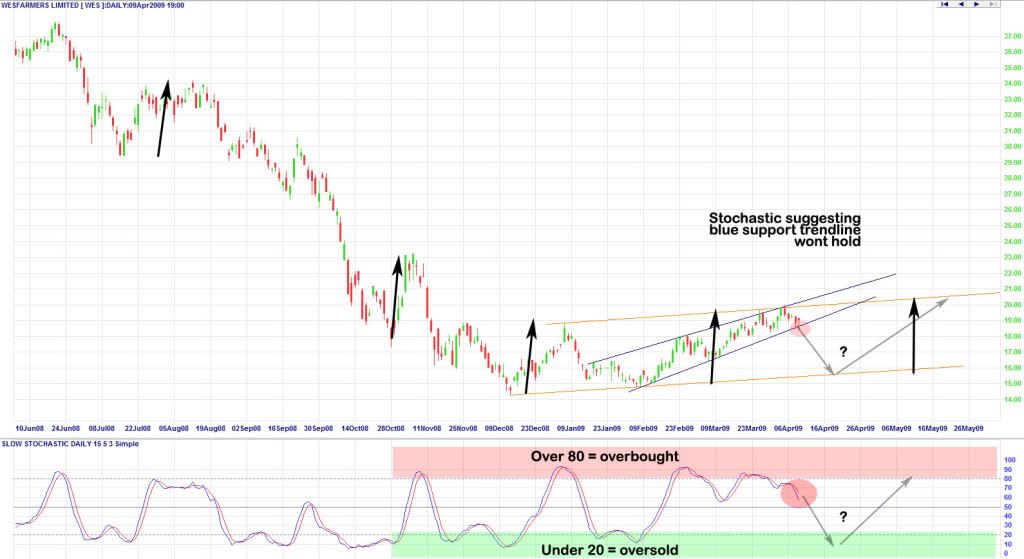
You can see two sets of trendlines. The two blue lines are a fairly steep narrow upwards trending channel. The orange trendlines are a more broad, slower rising channel. The stochastic has turned down, this suggests that the lower blue support trendline might not hold much longer. I predict a break of the blue trendline will see a fall back down to the lower orange trendline, where the stochastic would likely be oversold at that point. This could happen around 15.5-16 dollars. Then we could see a rally back to the upper orange trendline. The channel, and previous speed angles (black arrows), could see this rally reach $20-20.5
Weekly-
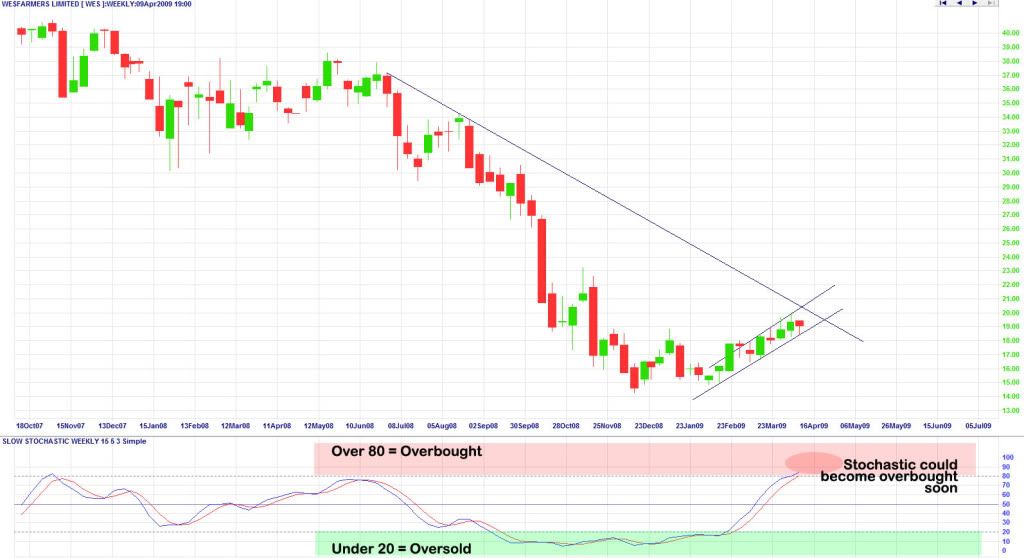
Price is in a nice upwards trending channel. However, the stochastic is approaching overbought. There is also some overhead resistance that could come into play left over from last year. The resistance levels would be around $20
Monthly-
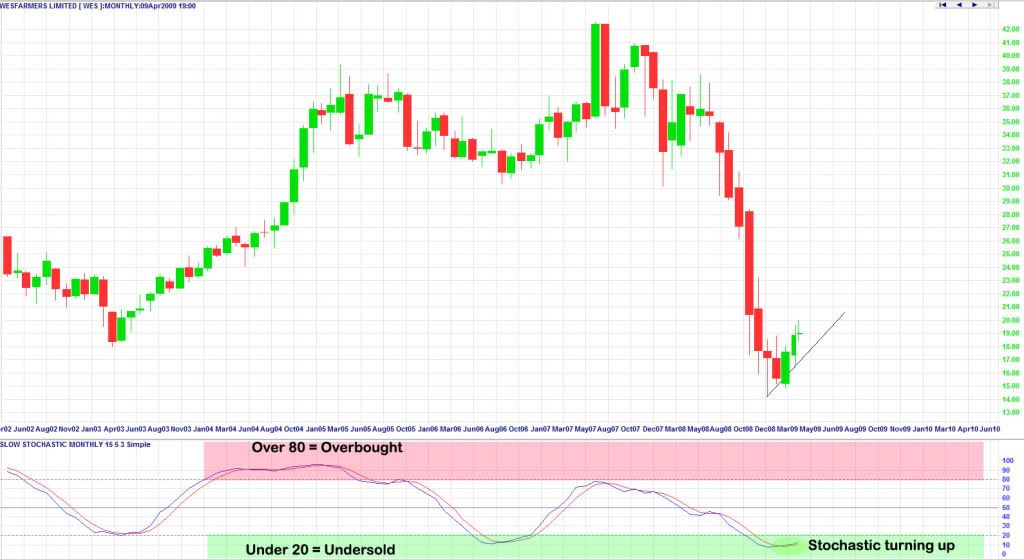
Currently in an upward trend. We could see a return back to the lower trendline due to the weekly and daily charts, however it is likely the upward trend will continue, as the stochastic is turning up from very oversold currently.
Overall-
Look for a possible pullback in the short term towards 16 dollars, then a rally to 20 where it would meet resistance on the daily and weekly charts. The weekly could see futher falls within the next few months, however the long term trend does seem to be up, as displayed on the monthly chart and indicators.
- Forums
- ASX - General
- weekend charting
Ange, no problem, hope it works :)Here is my WES chart.Daily-You...
Featured News
Featured News
The Watchlist
RAC
RACE ONCOLOGY LTD
Dr Pete Smith, Executive Chairman
Dr Pete Smith
Executive Chairman
SPONSORED BY The Market Online


